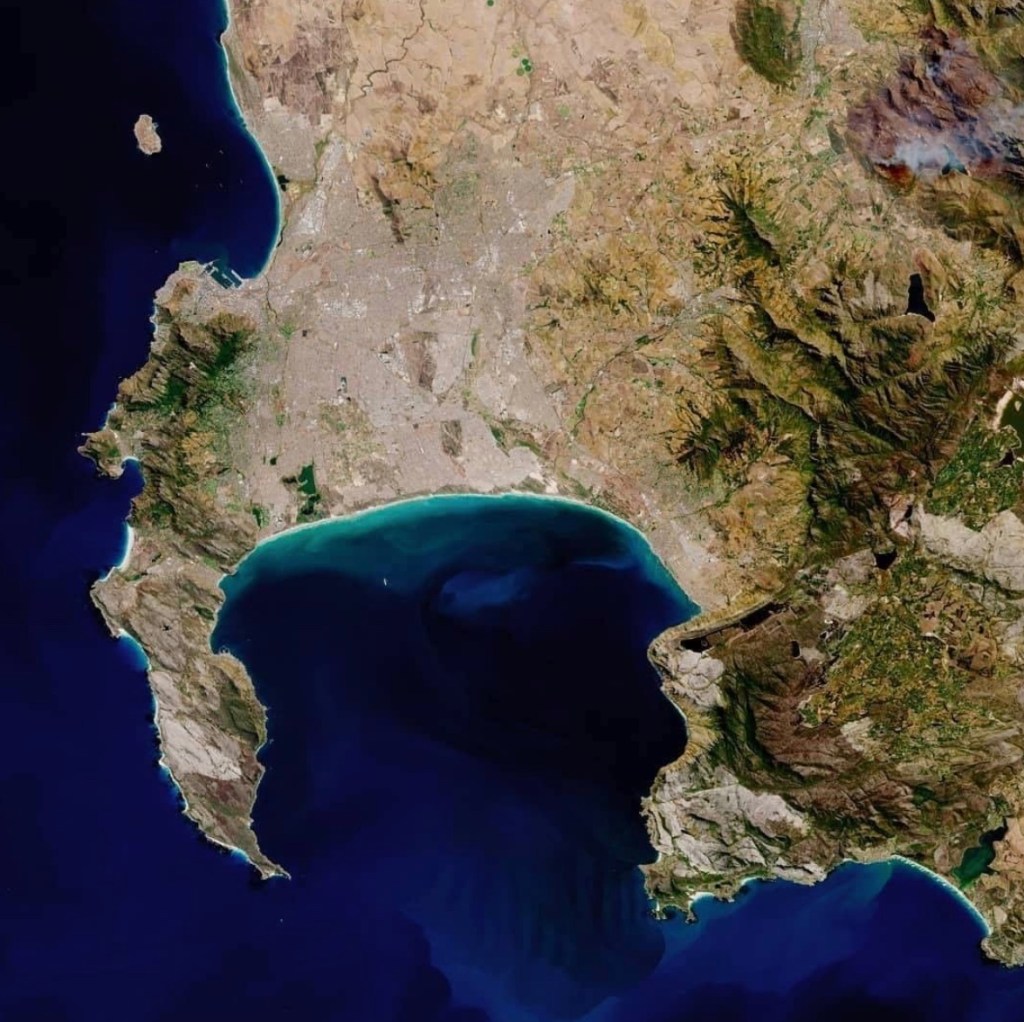
Figure 1: Aerial View of Cape Town from space. (capetownetc, 2020)
Welcome to my blog on the city of Cape Town. I will be posting a variety of entries over the next term, which will examine the city through an urban political-ecological (UPE) lens. I will critically explore a wide range of issues facing the city to develop a narrative into how urban metabolisms shape everyday life in Cape Town.
Cape Town is a port city in South Africa which was developed by the United East India Tea Company (Wilkinson, 2000). With a population of just over 4 million people and a municipality area of 2461km2, Cape Town is the largest city within the Western Cape (WCP, 2017) (City of Cape Town, 2011).
The city is situated in a biodiversity hotspot and the natural setting of the Cape Floristic Region, making it one of the most biodiverse cities of the world (Cilliers et al., 2012). A city of stunning physical beauty, Cape Town showcases rich and diverse flora and fauna, and beautiful landscapes, including Table Mountain and the Cape Point (Figure 2).
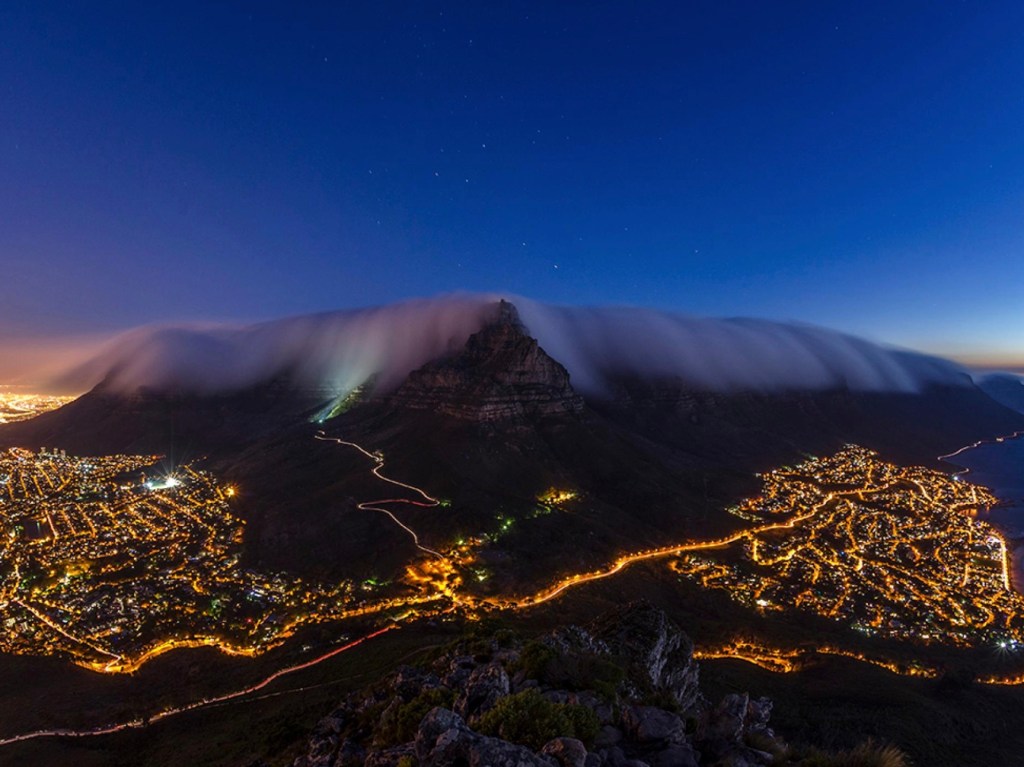
Figure 2: Cloud cover over Table Mountain. Source: (Wainwright, 2015)
A UPE account will go way beyond the simplistic forms of nature living within the city. A UPE account will go way beyond the simplistic forms of nature living within the city. Let’s explore beneath the beauty and examine the flows and interactions between people, the city and environment. Carefully examining the different metabolisations at work in Cape Town will expose the often invisible societal, environmental and political processes in operation, and the consequences which they produce (Swyngedouw et al., 2003).
Cape Town is deeply entangled in a history of colonialism and apartheid. Centuries of Cape Town is deeply entangled in a history of colonialism and apartheid. Centuries of British and Dutch rule have driven racial segregation and inequalities within the city. During apartheid, segregation was issued as a policy, which created deeply uneven landscapes throughout the city, which still exist today. In many areas of Cape Town, densely populated townships and spacious affluent neighbourhoods’ live side by side (Figure 2). National census data estimates that 218,780 households are living in informal settlements which represent 21% of households in Cape Town (Stats SA, 2011a).
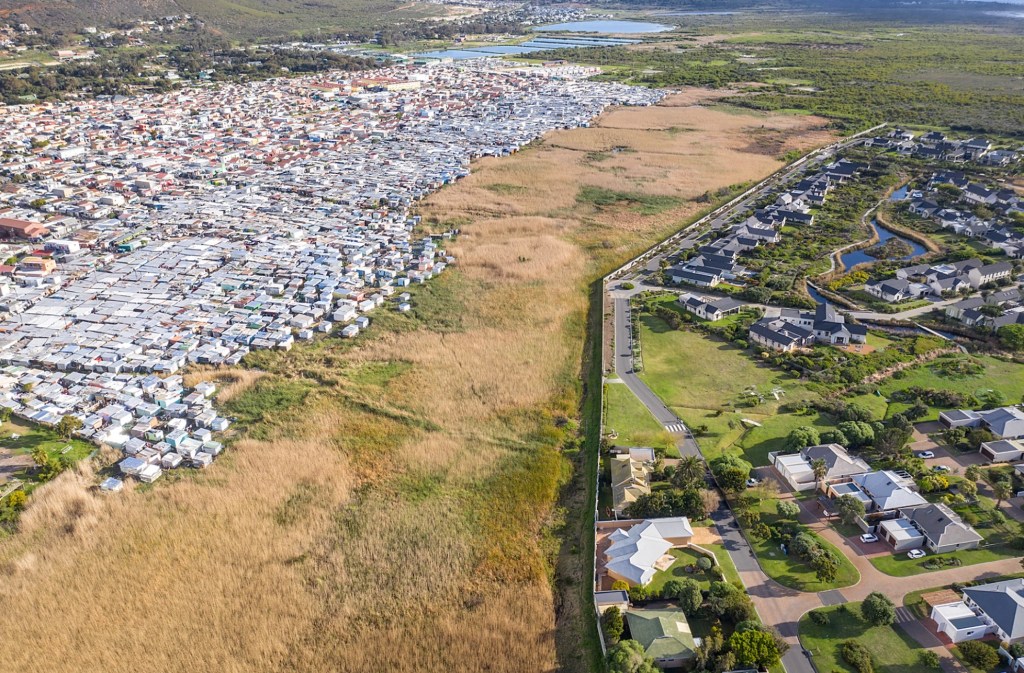
Figure 3: Neighbouring areas of Masiphumelele and Lake Michelle. Source: Unequal Scenes, Miller, 2018
UPE draws attention to the socio-spatial and environmental processes of uneven geographic development and recognises that material conditions are controlled and manipulated to benefit more affluent social groups while negatively affecting more marginalised groups (Heyen, 2014). Cape Town, “a neoliberalising post-apartheid city with a developmental state” (McDonald, 2012) is an incredibly complex site which opens up numerous questions of inequality, environmental justice, struggle and power relations. I am curious to explore the relationship between people and nature in Cape Town through a variety of ecological and political issues, and ask the critical questions of “why (…) ‘things as such’ [are] produced in the way they are – and to whose potential benefit” (Kirsch and Mitchell 2004 in Swyngedouw 2006b, 29).
Aisling Friel – 469 words
References:
Cilliers, S. and Siebert, S. (2012). Urban Ecology in Cape Town: South African Comparisons and Reflections. Ecology and Society, 17(3).
Heyen, N., Swyngedouw, E. and Kaika, M. ed., (2006). Metabolic urbanization. The making of cyborg cities. In: In the nature of cities. Urban political ecology and the politics of urban metabolism. London, New York: Taylor and Francis, pp.21-40.
Heynen, N. (2014), “Urban political ecology I: The urban century.” Progress in Human Geography, 38(4)
McDonald, D. (2012) World city syndrome: Neoliberalism and inequality in Cape Town, London: Routledge.
Stats SA (2011). South African national census: Western Cape Municipal report. Pretoria: Stats SA.
Swyngedouw, Erik & Heynen, Nik. (2003). Urban Political Ecology, Justice and the Politics of Scale. Antipode. 35. 898 – 918. 10.1111/j.1467-8330.2003.00364.
Western Cape Government (2017). Socio-Economic Profile: City of Cape Town. Cape Town: Western Cape Government.
Wilkinson, P. (2000). City profile: Cape Town. Cities, 17(3).
Figures:
Figure 1: Capetownetc [@Capetownetc], (2020). Cape Town from Space, 27 April [Instagram] Available at: <https://www.instagram.com/p/B_fX_ftKm4A/?igshid=16dh1j42hmrcf> [Accessed 30 April 2020].
Figure 2: Wainright, B., 2015. Cloud Cover Over Table Mountain. [image] Available at: <https://www.nationalgeographic.com/photography/photo-of-the-day/2015/4/table-mountain-fog/> [Accessed 4 February 2020].
Figure 3: Miller, J. (2018). Unequal Scenes Photographic Project. [online] Unequalscenes.com. Available at: https://unequalscenes.com
