The ‘Sinking’ Blue City?

This post has been edited and rewritten (not deleted because of companion’s comment). For the replacement post, click here.

It is particularly important to look at the way in which cities manage their water, as they are 2% of land surface on Earth, yet account for 60-80% of energy consumption and 75% of global CO2 emissions (Koop & Leeuwen, 2017:389). This puts enormous pressure on water supply, solid waste recycling and wastewater treatment. Floods are one of the most common “natural disasters” that occur in Europe, and mitigating this is of utmost importance in a country like the Netherlands; one that is constantly battling being overcome by the very water that gives them life, and their image.

The largest issue with disaster risk management worldwide is the emphasis on retroactive action: a response to something that has already happened, and many argue that it should instead be preventative. The Netherlands is a world leader when it comes to water management, but not due to their foresight. In 1953, they experienced major sea flooding which caused huge loss of life and damage to infrastructure. To prevent events like these from occurring again, the Netherlands created a Delta Programme. Under the Delta Act, the Programme has to be updated annually, and sets up a conceptual framework for research and legislation to create preventative measures.

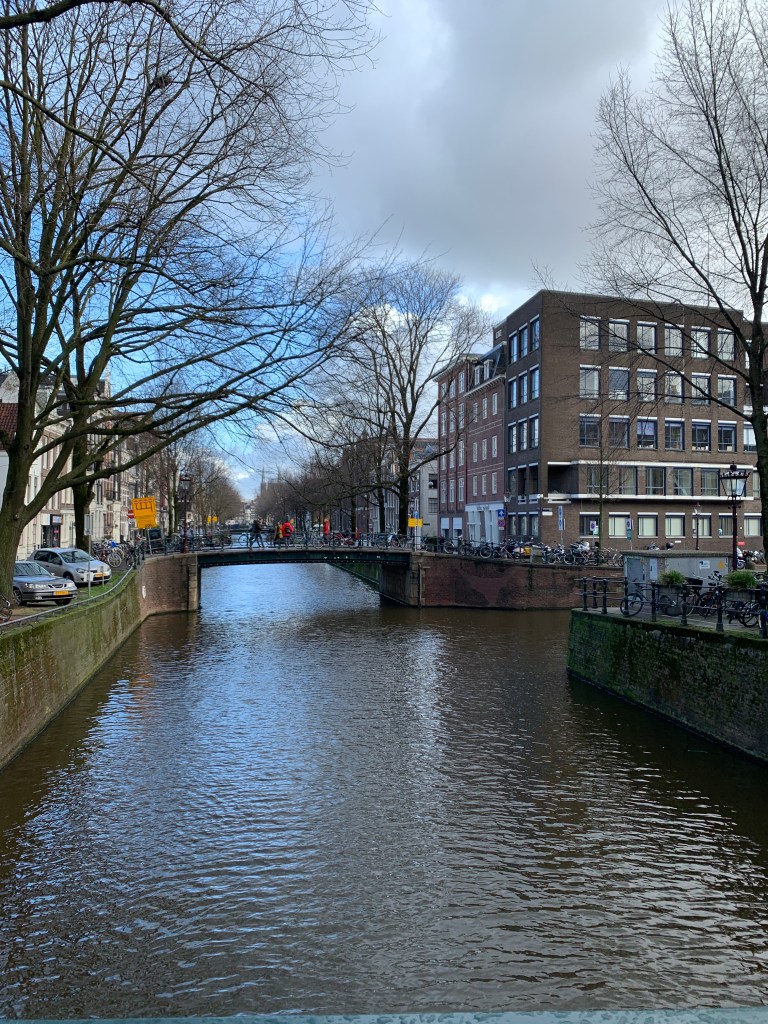
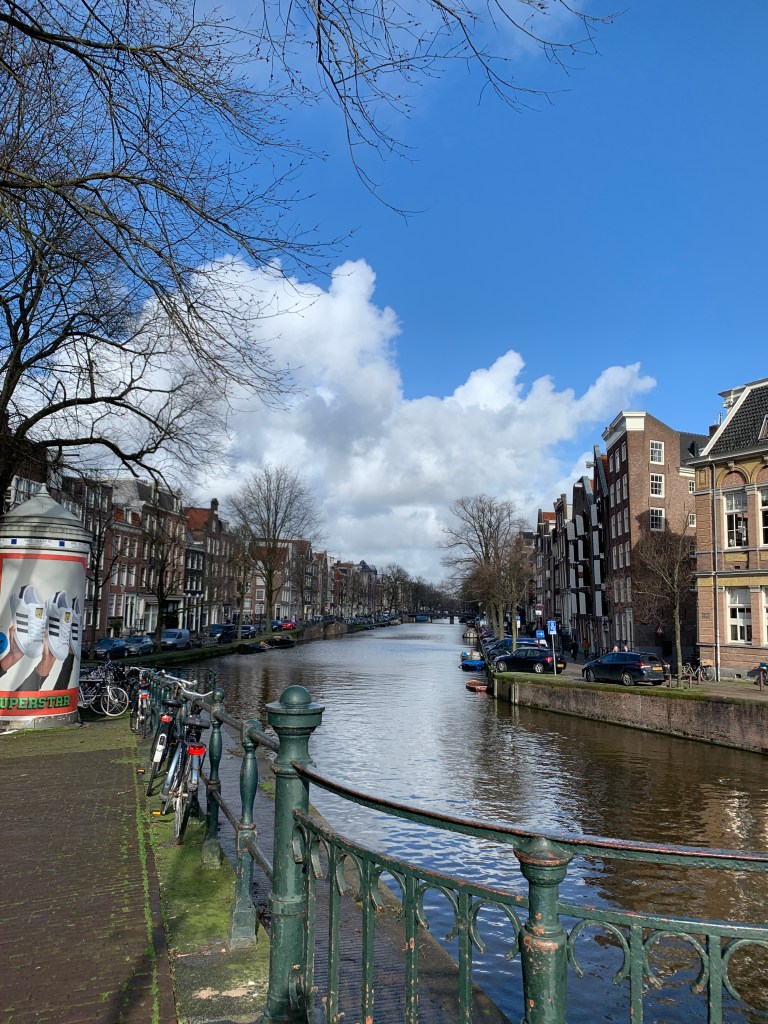
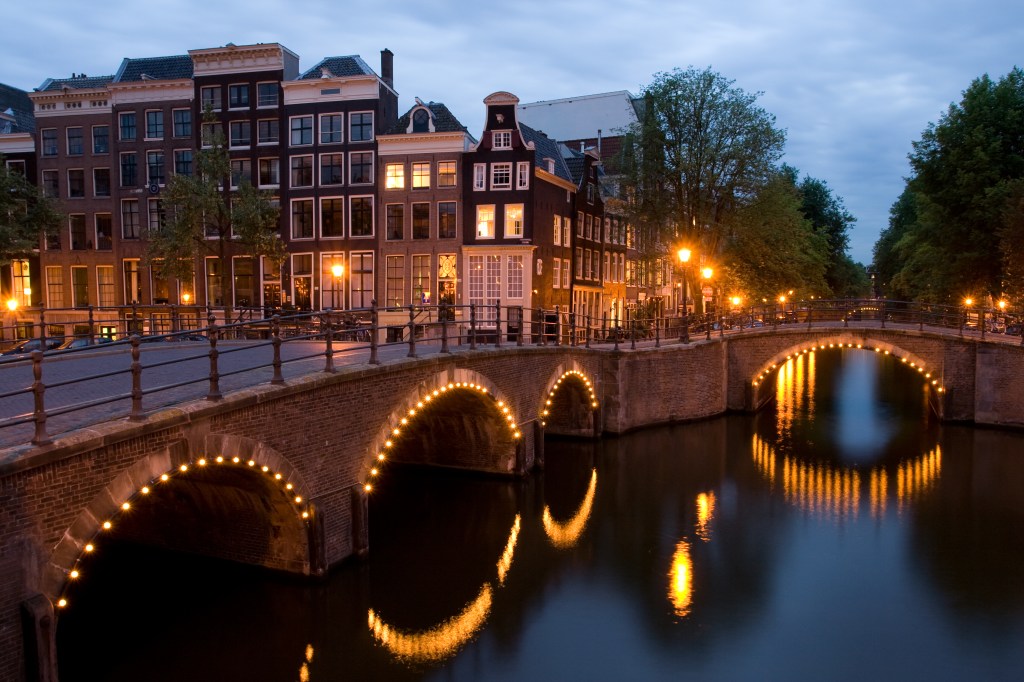
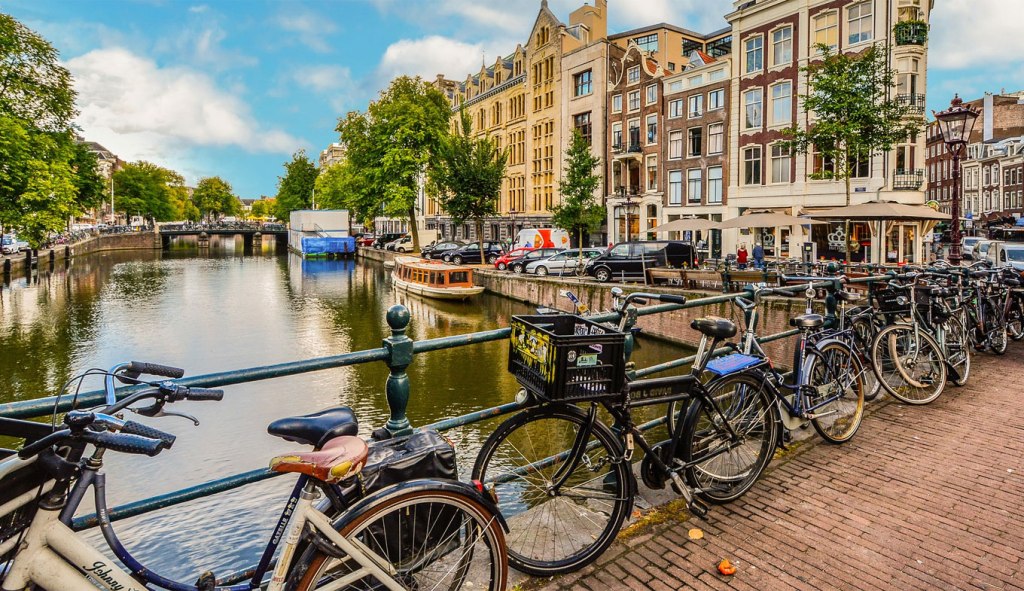
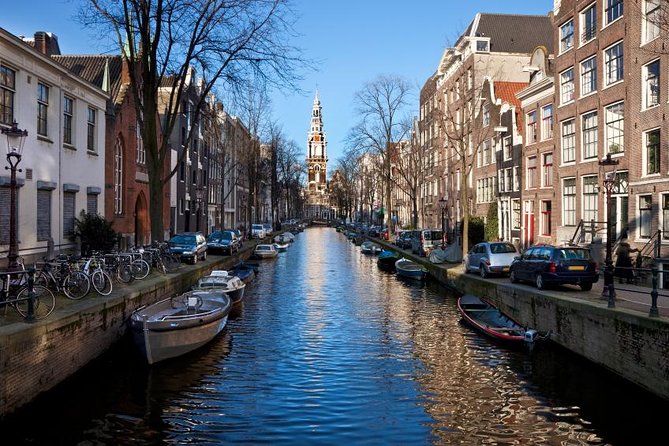
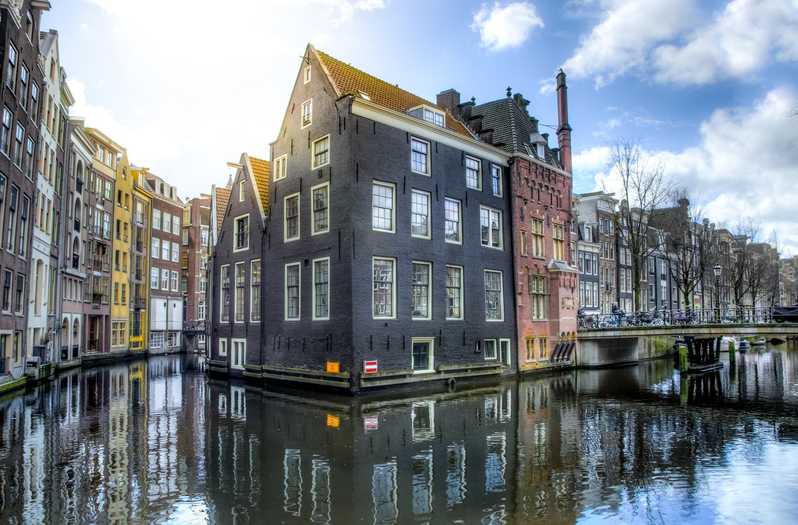
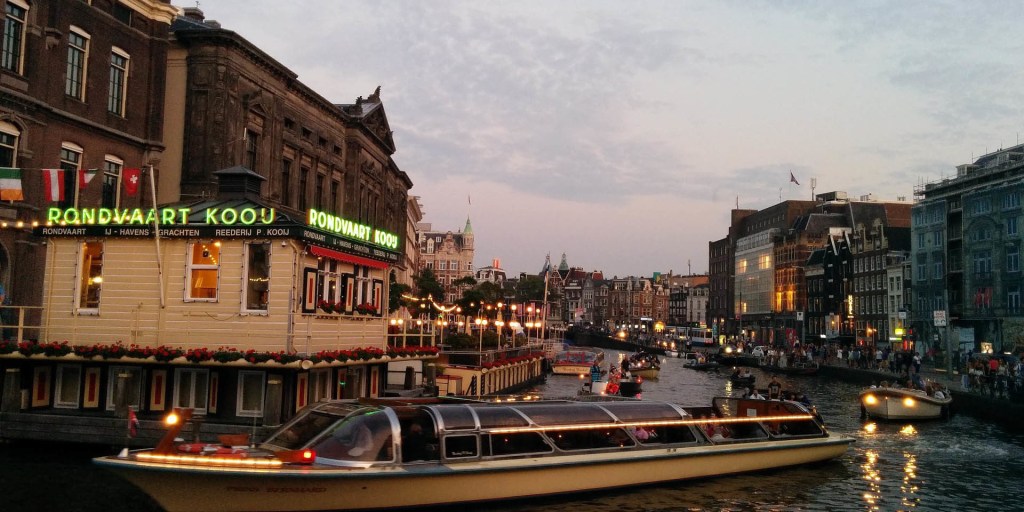
Amsterdam’s intricate canal system is famous worldwide. Initially built to facilitate trade, now it provides recreational use for tourists and locals alike, as well as a means for water management upon which the city depends on. The city’s image is completely blue.

Images of souvenirs in the shop of Het Grachtenhuis (The canalhouse) Museum

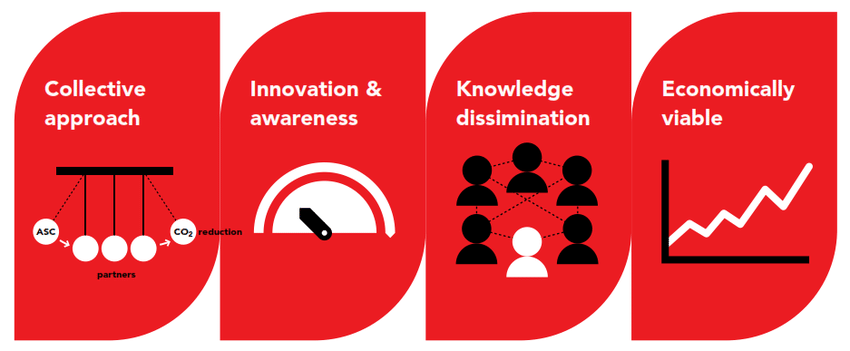
The ‘natural infrastructure’ of the city is built and operates through this sophisticated system of water governance, based on functional democracies, as well as including stakeholders through a “polder approach”, the Dutch method of decision making through consensus (Schreuder, 2001).

Being built on layers of peat and clay, Amsterdam has different issues to most cities in terms of water management. The city is in a constant battle of sinking into the North Sea, and consequentially being “dragged out” by citizens (Devaney, 2015). These layers of material slowly become compressed into thin layers below the surface, molded by the water seeping through.

The maximum amount the layers can sink by is 20cm before intervention must occur, as that is when surface areas become affected.  The Amsterdam council tries to maintain a structure of democratic involvement, which is why there is an emphasis on community involvement in the more precarious danger zones. The people are in charge of the decision making regarding raising the areas back to their previous levels. Elected council members (similar to aldermans) are in charge of informing the citizens when, why and how their neighborhoods will be reconfigured.

A Diemen pavement beginning to sag. Photo by Beluah Maud Devaney

The issues Amsterdam faces with water management arise from the narrative of excellency in this field that most citizens are used to. One of the largest issues to combat in their water management system is the awareness gap that could lead to complacency (OECD, 2014). This counteracts the narrative of community involvement given in the article “Raising Diemen: Amsterdam’s never ending battle against the sea”. However, analyzing multiple sources, and what I know about Amsterdammer culture, has led me to believe that there is a relatively new lack of involvement as a whole from the city-dwellers.

Amsterdammers are less involved in policy debates than before, less concerned with water pollution and development has increasingly occurred without notice of risks at different locations (OECD, 2014). Citizens also do not know what the basics of evacuation policies are, nor the origin of water, or the level of risk of the locations of their homes due to a level of trust in government that may not be appropriate.

A large challenge is that the actors who benefit from spatial development do not have responsibility over costs related to water risks. Ongoing spatial development increases exposure to flood risk. This has lead to equity issues relate to escalation of costs of water management, including those of private home owners to deal with “sinking” pavements.

Climate change poses the risk of even larger flood risks, as well as water scarcity and urban drainage that has to adapt to heavier rains.

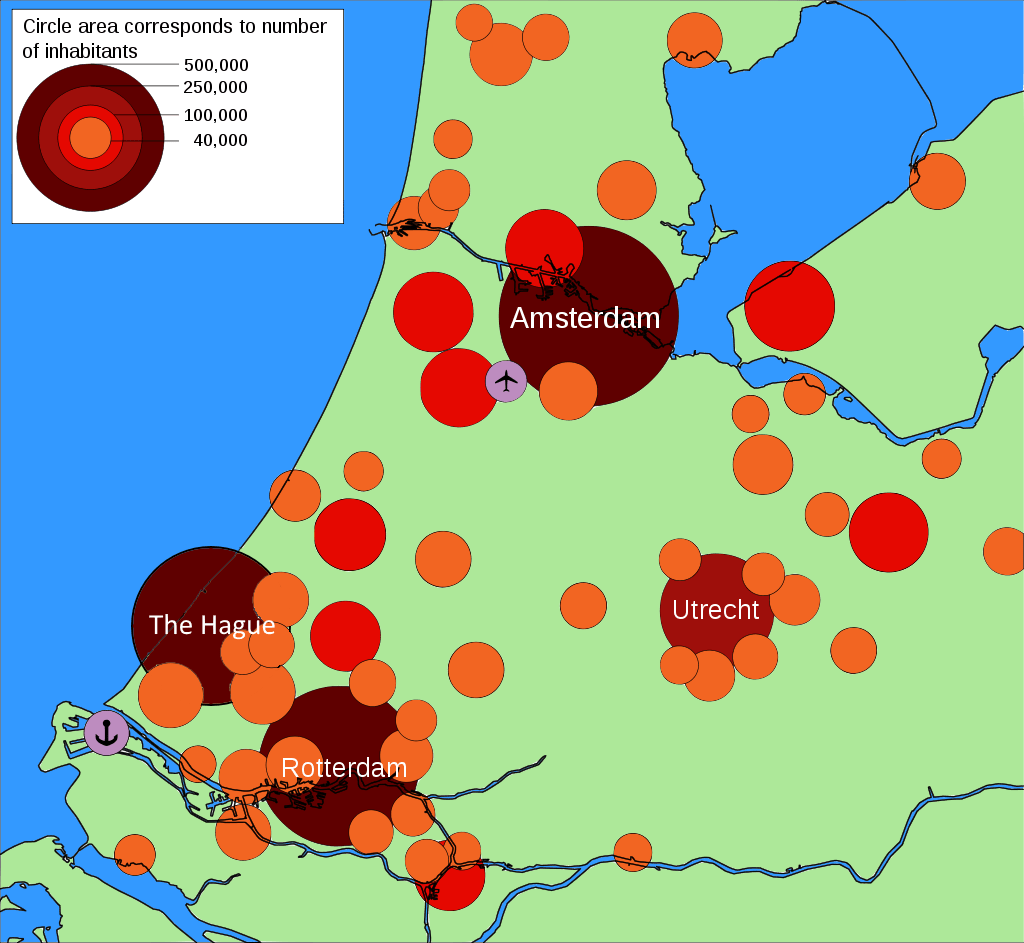
There are regional disparities in effectiveness of water management, the relevance to Amsterdam being the huge population growth in the “Randstad”, the megalopolis that it is in with the three other largest Dutch cities (Rotterdam, Utrecht, and Den Haag). What does this entail for flood safety standards? The risk gets worse in more populated areas. This also affects the speed in which the ground “sinks”- more people, more development, the quicker the peat and clay below the land compresses.

Bubble map showing the population sizes of larger towns and cities in the Randstad circa 2012
Another canal, taken by me

Amsterdam’s effective water management and risk assessment is one of the best in the world. But this could be its downfall. Water is in and around (and below) the entire city! The people need to fight to keep themselves updated, and with the help of the Delta Plan, this could grant them the capability of remaining on top of the steadily worsening conditions.

References:

  1. Devaney, B. (2015) Raising Diemen: Amsterdam’s Never-Ending Battle Against the Sea City Metric. Retrieved on 02/20/20. Accessed at: https://www.citymetric.com/horizons/raising-diemen-amsterdams-never-ending-battle-against-sea-1516
  2. Gawlik BM, Easton P, Koop S, Van Leeuwen K, Elelman R (eds) (2017) Urban Water Atlas for Europe. European Commission, Publication Office of the European Union, Luxembourg
  3. Government of the Netherlands, Retrieved on: 02/20/20. Accessed on: https://www.government.nl/topics/delta-programme
  4. Koop, S., van Leeuwen, C., (2017) The challenges of water, waste and climate change in cities, Environmental DEvelopment and Sustainability, Vol (19) pp 385-418
  5. OECD (2014), Water Governance in the Netherlands: Fit for the Future?, OECD Studies on Water, OECD Publishing. Schreuder, Y. (2001) ‘The Polder Model in Dutch Economic and Environmental Planning’, Bulletin of Science, Technology & Society, 21(4), pp. 237–245.

Word count: 823

Amsterdam through the UPE lens: Last Remarks

Amsterdam at night: Source

Amsterdam is a unique city. Researching this city employing urban political ecology’s framework allowed me to see how the municipality and city dwellers also think of the ‘tightly woven status of socionature from a critical stance on urban environments’ (Gabriel, 2014:40). Since 2010, Amsterdam’s environmental policy has incorporated the environment and the economy not as mutually exclusive but instead mutually dependent. 

Bikes along the canal: Source

Amsterdam’s focus on becoming an internationally competitive and sustainable European metropolis relies on being a creative city, integrating public transport, high quality urban planning, and investments in recreational green and renewable energy, attainable with the Doughnut model (van der Hoek et al, 2017). It is aided by policies such as: 

  • ‘The Strategic Vision Amsterdam 2040 Economically Strong and Sustainable’
  • ‘Amsterdam: A Different Energy- 2040 Energy Strategy’
  • ‘Amsterdam Really Sustainable 2011-2014’ 
  • ‘The Circular Metropolis Amsterdam 2014-2018’ (City of Amsterdam, 2010-2014)

Together these policies created the basis for the city’s focus on effective use of resources, and the transition from linear usage to a sustainable one. 

Westerkerk at the end of a canal: Source

As a result, and as we have analysed in this series of blog posts, the city’s efforts to become ‘smart’ through technological innovation, and the recent commitment to an urban-scale doughnut economy emphasizes an awareness of the dynamics between the human and nonhuman. How the coronavirus pandemic revealed certain societal inequities of race and age, caused certain environmental regulations to be alleviated, but also spurred forward a new sustainable economic plan for the city exemplifies the intricacies of urban life. However, there are many implications of doing so not analysed in these blog posts. Consensus-building is argued as essential in getting all stakeholders on the same page, but it could be said that antagonistic debate is more beneficial to environmental issues, as it prevents them from getting de-politicised and silencing opinions (Rosol et al, 2017). As a framework for each policy, this argument presents many potential critiques to Amsterdam’s governance. 

If I had more posts, I would have loved to further investigate how productive this approach has actually been, specifically looking at possible instances of greenwashing. The term sustainability is so open-ended, that it could very well act as an ‘empty-signifier’ not really achieving any ecological beneficial goals (ibid.: 1711). 


Regardless, thank you for joining me on this journey looking at how Amsterdam governs its urban space, urban subjects, and urban nature. I learned so much about this city and found myself feeling quite optimistic (only sometimes discouraged) by the municipality’s recent decisions. As UPE certainly allows us to analyse, there is always more than what the eye can see!

Word count: 425

References

City of Amsterdam, 2009. Amsterdam: A Different Energy – 2040 Energy
Strategy. Amsterdam: Report City of Amsterdam, Klimaatbureau

City of Amsterdam, 2010. Structuurvisie Amsterdam 2040 Economisch sterk en duurzaam (Structural Vision Amsterdam 2040 Economically strong and sustainable). Amsterdam: Report City of Amsterdam, Physical Planning Department.

City of Amsterdam, 2011. Amsterdam Beslist Duurzaam – Duurzaamheids programma 2011/2014 (Amsterdam Really Sustainable – Sustainability Program 2011/2014). Amsterdam: Report City of Amsterdam.

City of Amsterdam, 2014. De Circulaire Metropool Amsterdam 2014–2018 (The Circular Metropolis Amsterdam 2014–2018). Amsterdam: Report City of Amsterdam.

Gabriel, N. (2014). “Urban Political Ecology: Environmental Imaginary, Governance, and the Non-Human.” Geography compass 8(1): 38-48.

Rosol, M., Béal, V. and Mössner, S. (2017) ‘Greenest cities? The (post-)politics of new urban environmental regimes’, Environment and Planning A: Economy and Space, 49(8), pp. 1710–1718

van der Hoek, J., Struker, A. & de Danschutter, J. (2017) Amsterdam as a sustainable European metropolis: integration of water, energy and material flows, Urban Water Journal, 14:1, 61-68

Doughnut Economics: Amsterdam’s post-coronavirus economic plan

A doughnut: Source

Kate Raworth, from Oxford University’s Environmental Change Institute, created a new economic model, based on a shifted attitude of economics: one that aims to find an equilibrium between social and ecological factors encompassing humanity’s well-being. Instead of emphasizing the current linear goal of a never-ending GDP growth, this conceptual framework of social and planetary boundaries creates a shape similar to a doughnut (Raworth, 2017). The inner boundary represents a social foundation, with twelve dimensions based on the internationally agreed standards of 2015 Sustainable Development Goals by the UN. The outer boundary is an ecological ceiling beyond which lies an overshoot of pressure on the planet’s life supporting systems. As, under current policy, millions of people’s lives fall short of the social standards of nutrition, health care, housing, income, etc., and human activity has overshot at least four planetary boundaries, Raworth (2017) created this compass to emphasize thriving in balance over endless growth

The Doughnut model: Source

Amsterdam recently announced its commitment to the doughnut model to rebuild the city’s economy after the Covid-19 crisis, being the first city in the world to do so. Municipality officials met with Raworth to create a city-scale of this circular economy, and formally embraced it as the starting point for all public policy decisions. The doughnut grants a framework to think about climate, health, jobs, housing, care and communities simultaneously. 

“We are looking at our economy in a completely different way: how we produce, process and consume.”

(City of Amsterdam)

Amsterdam model: Source

The city plans on being completely circular by 2050, based on reusing raw materials to avoid waste and reduce Co2 emissions. For example, its new vision includes lengthening the life of materials by emphasizing repairing and sharing instead of throwing away, and having the port completely independent of fossil fuels. The municipality has already begun to create monitoring tools to track and trace raw materials, and also aims to cut food waste in half by 2030, rerouting surplus to residents in most need (Wray, 2020). Construction tenders will have stricter requirements of sustainability, and buildings will have ‘passports’ noting materials that may still be valuable or recycled upon demolition, such as insulation, timber frames, bitumen, doors, metals and stone (Report 2019). The municipality has already begun working with businesses and research organisations on over 200 circular economy projects (Edel, 2020). 

Thinking employed in Doughnut model: Source

The doughnut helps look at how things are interlinked, granting you a bigger picture of issues. It shows the economy not as the neoliberal story of a self-contained market, but as one that is embedded, emphasizing its dependence on society and the living world (Raworth,2017). It extends the metaphor of urban metabolism past the plane of raw materials, and into society. It also allows a shift in the perception of human nature to social, adaptable and interdependent beings embedded within the ecosystem (ibid). The model employs the economy as a series of dynamic complex networks, and not one that must adhere to an imagined mechanical equilibrium of the market. Of course, this sort of paradigm shift is no easy task. It seems that Amsterdam has to change the mentality of all its citizens away from a ‘capitalist imaginary of endless economic growth’ and into one that is more UPE style focused on flows and processes (Wright and Nyberg 2014:206). 

Kate Raworth on the model: Source

‘The coffee I sip connects me to the conditions of peasants in Columbia or Tanzania … to climates and plants, pesticides and technologies, traders and merchants, shippers and bankers, bosses and workers.’ (Swingedouw and Kaika, 2008:568)

Furthermore, this model provides a space to talk about issues that were previously shrouded in importation and production. It links a product to the processes that made it possible for your consumption: a perfect tool for UPE. For example, the Port of Amsterdam is the world’s single largest importer of cocoa beans. These are usually imported from West Africa, where labour is often highly exploitative (Raworth et al, 2020). The value of this model, says Raworth, is that it enables a conversation shift about Amsterdam which includes labour rights in, as per this example, West Africa. It grants you the tools to question whether you want your city to be a place that condones this type of exploitation on a global scale (Boffey 2020).  

Floating renewable battery to recharge boats in Amsterdam Port: Source

Of course, this shift does not come without friction. As pioneers of the urban doughnut model, the city of Amsterdam is aware that the future is uncertain (Wray, 2020). Experimentation and acceptance of risk must be acknowledged by society, and together the city must break old habits. Many benefits may not be noticeable straight away, or they may not even occur in the city itself. Sometimes, the benefits could occur on the other side of the world. But Amsterdam’s policy makers believe the city is progressive enough and liberal enough to stand up to the challenge and invest in the future by protecting people, and the planet. 

Word count: 808

References

Boffey, D. (2020) “Amsterdam to embrace ‘doughnut’ model to mend post-coronavirus economy” The Guardian. Retrieved at: https://www.theguardian.com/world/2020/apr/08/amsterdam-doughnut-model-mend-post-coronavirus-economy#maincontent

Edel, D. (2020) “Amsterdam is the First City to Implement the Doughnut Economic Model” Intelligent Living. Retrieved at: https://www.intelligentliving.co/amsterdam-doughnut-economic-model/

Hill, J. 2020 Floating renewable battery launched to recharge boats in Amsterdam, The Drive.

Raworth, K. (2017) A Doughnut for the Anthropocene: humanity’s compass in the 21st century The Lancet Vol 1(2) pp. 248-e49

Raworth, K. (2017) Why it’s time for Doughnut Economics IPPR Progressive Review Vol24(3) pp. 216-222

Raworth, K., et al (2020) Report: The Amsterdam City Doughnut (A Tool for Transformative Action), Retrieved at: https://www.kateraworth.com/wp/wp-content/uploads/2020/04/20200406-AMS-portrait-EN-Single-page-web-420x210mm.pdf

Wray, S. (2020) “Amsterdam adopts first ‘city doughnut’ model for circular economy” SmartCitiesWorld. Retrieved at: https://www.smartcitiesworld.net/news/news/amsterdam-adopts-first-city-doughnut-model-for-circular-economy-519

(2019) Report: BUILDING BLOCKS FOR THE NEW STRATEGY AMSTERDAM CIRCULAR 2020-2025, Collaboration of Raworth, K., City of Amsterdam, Circular Economy. Retrieved at: https://assets.website-files.com/5d26d80e8836af2d12ed1269/5de954d913854755653be926_Building-blocks-Amsterdam-Circular-2019.pdf

Cape Town: Happy Feet

Figure 1: Video Showing penguins strolling down street in Cape Town.
Storyful Rights Management, 2020

Wild goats roam around Llandudno, North Wales, boars have descended from the mountains to the centre of Barcelona, and an estimated 1000 monkeys rummage through rubbish and fight for food in the Thai city of Lopburi. Covid-19 has sparked curiosity amongst urban wildlife which normally remains out of sight in the city.

As the residents of Cape Town self-isolate and streets are left empty, wildlife has begun to reclaim the streets. The video above presents three penguins casually waddling down Cape’s streets towards the ocean (Figure 1). Boulder’s Beach in Cape Town is one of the only places in the world where people can interact with the famous citizens of the city, the African penguins (Figure 2). The penguins which are usually anxious when humans or cars are too close are enjoying their new freedoms.

UPE seeks to shift the uneasy understandings that cities are ‘ontological’ entities, detached from non-human forms and organisms which shape urban life (Tzaninis et al., 2020). The penguins who typically remain out of sight are a gentle reminder of how cities are inextricably wrapped up in human-animal relations (Hovorka, 2008). Non-human inhabitants are central urban actors who shape the city and influence human actions. Many urban geographers are beginning to embrace the urban as spaces of human-non-human activity. Rather than living against nature, we live with nature.

Thank you for joining me on my journey exploring Cape Town’s metabolic flows. I hope that you have enjoyed learning about some of the UPE issues of Cape Town. Like many cities, Cape Town is home to inequality, social disparity and injustice. I confronted these issues across each blog topic which emphasises the devastating effects apartheid has had on the city. These problems are still extremely prominent in Cape Town and times of crisis such as the drought or Covid-19, bring the growing inequalities to light.

The city’s relationship with nature is complex, filled with both joys and injustices.  I have maintained a critical and analytical approach throughout each blog and exploring Cape Town through a UPE lens has, without a doubt, raised many shocking realities. However, nobody likes a sad ending. Although Cape Town is facing many challenges, the city is working to decrease inequality, injustice and environmental degradation. The city recently released their resilience strategy in 2019, which includes policies to improve the lives of poorer residents and create a more inclusive, healthy and environmentally friendly city (City of Cape Town, 2019).

Word Count: 437

References:

City of Cape Town, 2019. Cape Town Resilience Strategy. Cape Town: City of Cape Town.

Hovorka, A. (2008). “Transspecies urban theory: chickens in an African city.” Cultural Geographies 15(1): 95-117.

Love Cape Town, 2020. Covid-19 Lockdown. Available at: <https://www.capetown.travel/covid-19-lockdown-alert-levels/&gt; [Accessed 29 March 2020].

Tzaninis, Y. et al. (2020) ‘Moving urban political ecology beyond the ‘urbanization of nature’’, Progress in Human Geography. doi: 10.1177/0309132520903350.

Figures:

Figure 1: Storyful Rights Management, 2020. Penguins Stroll In Quite Street In South Africa. Available at: <https://www.youtube.com/watch?v=p5nxZR-sxNE&gt; [Accessed 20 April 2020].

Figure 2: Love Cape Town, 2020. African Penguins at Boulders Beach. Available at: <https://www.capetown.travel/get-to-know-the-african-penguins-at-boulders-beach/&gt; [Accessed 29 March 2020].

How Smart is Amsterdam?

Amsterdam Smart City initiative project: Source

Although the digitalisation of cities seems like a 21st century issue, efforts to improve city services through data analytics have existed since the 1960s (Mora & Bolici, 2017). Thus, comes the well-known concept of a “Smart City”. The European Commision defines it as a place where the urban, political, and ecological combine with the technological.

Amsterdam’s Smart City (ASC) initiative, now 11 years old, was founded by its predecessor of sorts, Amsterdam Innovation Motor (AIM) and grid manager Liander, in close collaboration with the Amsterdam Municipality (ASC, 2011). Acting as an “accelerator” for climate and energy projects, this public private partnership has produced more than 80 pilot projects across many aspects of urban life (Fitzgerald, 2016). It is seen as a model for aiding bottom up projects with the aims of enhancing efficiency, environmental performance, and quality of life influenced by citizen participation. 

Conceptual model of ASC: Source

The initial 16 projects launched by ASC managed to reduce energy usage by 13% in the city, working within their main project areas of: sustainable living, sustainable working, smart mobility, smart areas, smart economy, big and open data, infrastructure and living labs (ACS, 2011). Some of the projects include Zonspot: an outdoor workplace, energy derived from solar power with internet access, and Zuidas Solar Challenge: where 3,000 solar panels were built on Zuidas building tops. 

ASC pillars: Source

Another project by ASC did not have such successful outcomes. Apps for Amsterdam challenged creators to use public data to make apps that enhanced the lives of city residents and tourists. The first app was a public toilet finder. Another app showed users which houses were the best to steal from, using information on street lighting, house price, and distance from police stations (Fitzgerald, 2016). 

Modular city lighting to save energy: Source

According to Ger Baron, chief technology officer of the city, Amsterdam is still not quite “smart”. Integral to smart city initiatives is the integration of private sector data in order to change policy: citizens are at the heart of these activities (SCIS, 2019). As Amsterdam households were responsible for 33% of CO2 emissions in 2009, one of the most important pillars of ASC is creating awareness to reduce energy consumption in households through smart meters, energy measurement systems, etc.  Since no single organization or person coordinates all distinct “smart” efforts, it is truly exemplary of the classic Dutch polder model of citizen participation. The ASC website itself is an interactive platform where entrepreneurs can share their sustainable, innovative businesses or ideas in a community setting.

ASC pilot solar powered tram stops: Source

Amsterdam’s smart city efforts offer insight to the complexities facing city managers when it comes to data opportunity, as it involves a collaboration of a diverse group of stake-holders trying to achieve their own goals. From NGOs, municipality officials, business owners, and all sorts of quasi-governmental or governmental agencies, making Amsterdam smart requires participation from all levels focused on f making Amsterdam sustainable. 

Digitalisation of information to improve city life in an ecologically sustainable way encompass two of the driving levers of Amsterdam’s goal to be a Circular Economy, discussed in the next post!

Word count: 503

References 

Amsterdam Smart City (2010). Climate street Amsterdam. Amsterdam Smart City. Retrieved April 25, 2020, from https://www.youtube.com/watch?v=g4SoFQkYcmw.

Amsterdam Smart City (2011a). Smart stories. Amsterdam Smart City. Retrieved April 24, 2020, from https://www.youtube.com/watch?v=b27FyhhF5Jk.

Amsterdam Smart City (2011b). 5 new Amsterdam Smart City Projects. Amsterdam Smart City. Retrieved July 25, 2014, from https://www.youtube.com/watch?v=NiXTpLpmVhg.

Amsterdam Smart City (2013). Amsterdam Smart City: Smart stories. Amsterdam Smart City. Retrieved July 25, 2014, from https://www.youtube.com/watch?v=FinLi65Xtik.

Capra, C. (2016) The Smart City and its Citizens: Governance and Citizen Participation in Amsterdam Smart City International Journal of E-Planning Research, Volume 5(1), pp 1-19

European Commission (2018) What are Smart Cities? Accessed on April 9, 2020. Retrieved at: https://ec.europa.eu/info/eu-regional-and-urban-development/topics/cities-and-urban-development/city-initiatives/smart-cities_en

Fitzgerald, M. (2016) Date-Driven City Management: a Close Look at Amsterdam’s Smart City Initiative

Mora L., Bolici R. (2017) How to Become a Smart City: Learning from Amsterdam. In: Smart and Sustainable Planning for Cities and Regions. SSPCR 2015. Green Energy and Technology. Springer, Cham

Putra, Z. (2018). The Interaction Between Non-Government-based Smart City Projects and Government-based Environmental Management: The Case of Amsterdam.

SCIS Editor (2019) ATELIER Smart City project to turn Amsterdam and Bilbao into citizen-driven Positive Energy Districts. Accessed on April 9, 2020. Retrieved at: https://smartcities-infosystem.eu/newsroom/news/atelier-smart-city-project-turn-amsterdam-and-bilbao-citizen-driven-positive-energy

UPE and Toronto: Final thoughts

Throughout the preceding seven posts, this blog series has adopted an Urban Political Ecology lens to critically assess environmental and societal issues in and around Toronto.

The series of posts has looked at air pollution, the GTA’s greenbelt, urban risk, urban nature such as green roofs, waste and the outbreak of COVID-19. By using concepts within Urban Political Ecology, the posts have discussed how urban environmental issues are dealt with by the authorities and the city’s inhabitants, revealing how nature is framed and the power relations between certain communities. Toronto’s diverse inhabitants make it an interesting case study for unequal power relations, with the current COVID-19 outbreak highlighting those in the case of the Chinese community.

Other concepts have been explored too, including the ways in which communities respond to environmental issues. The posts on air pollution, urban risk, greenbelt and waste imply that individual’s and communities can create change without direction from central governance. The ongoing debate over what is, where do we find, and how do we connect with ‘nature’, can be seen throughout the whole series of posts. What people see as ‘natural’ or what is ‘nature’ often shapes the ways in which it is treated by society.

It has been interesting finding out more about Toronto, and to combine this with an evolving literature has made this series of blog posts an enjoyable experience. UPE provides several important perspectives for how urban lives are intertwined with the natural world, emphasising the need to consider the relationship between the two, which often become one.

I hope you have enjoyed reading.

Word Count: 263.

Cape Town: Shebeen Queens

Throughout this blog, I have examined the flows of water, knowledge, capital and waste in the city. This post will follow a different path and explore how alcohol shapes and is shaped by the city. Don’t worry; I am not about to lecture you on the harmful effects of alcohol on our health and wellbeing. This exploration of alcohol will present a more grounded and nuanced narrative. Through a UPE lens, we can reframe alcohol as a flow rather than a substance fixed in place (Lawhon, 2012). Alcohol plays an important role in the formation of the cyborg city, creating sociality and shaping the materiality of urban life (Latham and McCormack, 2004). 

In Cape Town, there are many informal and illegal alcohol outlets, commonly known as shebeens (Figure 1) which have been central to regulation and numerous policies over the last decade (Smit, 2014). This discourse dates back to 1927, when South Africa passed the liquor act. This law prohibited non-white Africans from selling alcohol or entering licensed premises. The passing of the liquor act marked the beginning of a colourful and powerful narrative of South Africa’s shebeens. Shebeens “not only provided a crucial survival strategy amidst urban poverty, but … also facilitated the development of a spirit of community and companionship in areas noticeably lacking adequate social amenities” (DeHaas, 1991).


Figure 2: Women in Langa Shebeen. Chisholm, 2015

The women behind the Shebeens, the shebeen queens, saw the strong market for the African beer and began brewing the beer in their homes or yards, using generations-old recipes (Figure 2). Shebeens quickly became breeding grounds for new forms of art and expression. However, this was not without friction and contestation. Although drinking levels in South Africa are quite low, a significant proportion of drinkers engage in unsafe and risky drinking (Parry, 2005). High levels of dangerous drinking translate to high levels of violence, crime and disease. Therefore, the selling and consumption of alcohol have become heavily regulated.

Circulation

Multiple socio-material frictions inhibit the flows of alcohol (Lawhon, 2012). The flows and frictions of alcohol in Cape Town reveal a story about resistance and innovation; the drastic measures shebeen operators will take to overcome these frictions and keep their business alive. The illegal delivery of alcohol into townships is often discrete. However, the active drinking of alcohol in and around shebeens is not so easy to hide. The social aspect of alcohol integrates the presence of police into the process and flow. Under government regulations, police become a ‘friction’ who can stop the flow of liquor at these places through the confiscation of alcohol. Shebeen operators find various ways to protect their supplies by hiding their stock in nearby premises and retrieving the drink as required. The flow of alcohol, therefore, continues and the shebeens continue to thrive.

Spatial configurations such as drinking spaces are also widely recognised as a friction which reshapes the flow of alcohol. For example, the lack of tables in drinking spaces can increase the consumption of alcohol. People spend less time resting their drink on the table and consequently drink a lot faster (Lawhon, 2012). It is shocking how something so trivial like a table is considered as a source of friction.

Alcohol like water and waste flows through and is metabolised in Cape Town. Multiple socio-material frictions shape its journey. Examining the frictions of urban hybrids can help us to understand the flows, enabling cities to implement more accommodating and cooperative regulations and policies.  Shebeens are a significant source of employment, providing between 60,000 to 100,00 jobs (Herrick and Lawhon, 2012).  However, they are simultaneously facilitating high rates of alcohol-related harms. Cape Town must strive to find flexible, adaptable and integrated solutions which permit responsible consumption and retail while simultaneously reducing alcohol-related harms.

Word Count: 640

References:

De Haas, M. (1991). Of joints and jollers: Culture and class in Natal shebeens. In E. Preston-Whyte & C. Rogerson (Eds.), South Africa’s informal economy (pp. 101– 114). Oxford: Oxford University Press.

Latham, A. and D. McCormack (2004) ‘Moving cities: Rethinking the materialities of urban geographies’, Progress in Human Geography, 28, 6, 701-724

Lawhon M and Herrick C (2012) Shebeens in the news: Contesting alcohol control policies in the Western Cape, South Africa (under revision)

Lawhon M (2013) Flows, friction, and the sociomaterial metabolisation of alcohol. Antipode 45(3): 681–701

Parry, C. D. H. (2005). South Africa: Alcohol today. Addiction, 100, 426– 429

Smit, W., 2014. Discourses of alcohol: reflections on key issues influencing the regulation of shebeens in Cape Town. South African Geographical Journal, 96(1), pp.60-80.

Figures:

Figure 1: Leigh, T., 2017. South Africa’s Historic Speakeasies Are Still Thriving. [online] Vogue. Available at: <https://www.vogue.com/article/south-african-speakeasies-shebeens-guide&gt; [Accessed 10 April 2020].

Figure 2: Chisholm, B., 2015. Shebeens and their Beer Brewing Queens. [Blog] The Budget Safari blog, Available at: <https://www.africanbudgetsafaris.com/blog/the-shebeen-story/&gt; [Accessed 10 April 2020].

COVID-19: Chinese community in Toronto

Coronavirus, or COVID-19, is an infectious disease caused by a severe acute respiratory syndrome coronavirus 2 (SARS-CoV-2). The disease has become a global pandemic, with over 1 million cases being confirmed and over 75,000 deaths across 200 countries and territories, after the first case was reported in December 2019 in the Chinese city of Wuhan.

The disease spreads via close contact, and by small droplets, produced when those infected cough, sneeze, talk and even breath near others. To try and combat the spread of the disease, there have been several recommended actions, or non-actions, to take. The most commonplace are social distancing, frequent washing of hands, the use of masks where possible and covering coughs and sneezes.

COVID-19
Nurse waiting for patients at a testing centre in Toronto. Taken from: https://toronto.ctvnews.ca/toronto-confirms-seven-more-covid-19-deaths-city-adds-121-new-cases-1.4888691

As of Monday 6th, the Greater Toronto Area (GTA) had reported 1301 cases of COVID-19, with 32 deaths being confirmed and 77 having made a full recovery. In order to try and combat the spread of the disease, Toronto, like the rest of Canada and much of Europe including the United Kingdom, there has been a lockdown-style response. This has meant that non-essential businesses have had to close, social distancing of 2 metres unless they are residing together, banning of gatherings of more than 5 persons, and the banning of using park facilities. Failure to comply with these can result in fines between $75 and $100,000, and even with jail time for repeat offenders or businesses who continue to operate despite the rulings not to remain to open.

Similarly to the United Kingdom, Torontonians flocked to parks and green spaces before the formal lockdown. There were 1,175 formal cautions given out by officers across the weekend of 4th and 5th of April. On both sides of the Atlantic we have seen how people appear to value nature much more when the threat of not being able to access it whenever is apparent. Perhaps in the future, society will seek out nature more frequently and change the way we view nature, as we now see how quickly our access can be taken away.

Toronto is no stranger to dealing with a global pandemic. The SARS outbreak of 2003 led to 44 deaths, 213 infections and led to the quarantine of thousands of Toronto inhabitants (Ali and Keil, 2006). A constant thread of an UPE lens of which my posts has followed is the ways in which differing communities within Toronto are affected and thus deal with environmental and political issues. The current COVID-19 outbreak has brought about race tensions between the Chinese community in Toronto and their fellow Torontonians, previously seen in the outbreak of SARS in 2003, which, like COVID-19, also originated from China. Disease and discrimination have played out in an urban settings for hundreds of years, from the plague to cities such as Vancouver being shaped by immigrants locating in certain area of a city due to disease controls (Craddock, 2000). This blog post thus is not directly focused on the direct consequences of a disease like SARS or COVID-19, but instead assesses the impacts on the fabric of a city.

Inter-ethnic and inter-racial relations with Toronto have a tense history, and while modern policies have tried to promote multi-culturalism in the city and its suburbia, this could be seen as a mere smokescreen covering engrained racism in the distribution and availability of housing, employment and accessible services for example (Goonewardena and Kipfer, 2005). When an outbreak of a disease occurs, especially originating in a country where many migrants have moved from, China in both examples here, simmering race tensions come to fore. The Chinese community has seen verbal abuse in the streets, online vitriol via social media sites such as Twitter, and businesses that are Chinese-owned have been vandalised or seen significant reductions in their customer base. This mirrors some of the reaction that followed the outbreak in 2003.

The flows of migration into Toronto from Asian countries has occurred for over a century, and where they settle matters. Each boundary of so-called ‘Chinatown’ or enclaves have direct impact on its citizens. The citizens that reside are controlled by the enclosures of the divided place (Goldberg, 1993). Chinese settlers have been seen as the ‘Other’ in comparison to European migrants and the ways in which their enclaves have been constructed, physically and in the mind, present the areas as headquarters of disease (Ali and Keil, 2006).

This post has recognised the significance of COVID-19 on Toronto and its migrants, focusing on the Chinese community and how they are victimised. Using a previous outbreak such as SARS from 2003, we see parallels in how the community is portrayed. In doing so, we can see underlying race tensions and how they are enforced by the design and ongoing associations with Chinatown and its inhabitants. As well as this, we can see how nature is approached when access to it is restricted or prohibited, bringing back the UPE discussion around what nature is, where it begins and how people interact with it.

Word Count: 829

Reference List

Ali, S. H. and Keil, R. (2006) ‘Global Cities and the Spread of Infectiuous Disease: The Case of Severe Acute Respiratory Syndrome (SARS) in Toronto, Canada, Urban Studies.

Craddock, S. (2000) City of Plagues: Disease, Poverty and Deviance in San Francisco. Minneapolis: University of Minnesota Press.

Goonewardena, K. and Kipfer, S. (2005) ‘Spaces of Difference: Reflections from Toronto on Multiculturalism, Bourgeois Urbanism and the Possibility of Radical Urban Politics, International Journal of Urban and Regional Research, 29 (3), 670-78.

Goldberg, D. T. (1993) ‘Polluting the Body Politic: Racist Discourse and Urban Location. in Racism, the City, and the State, (eds.) M. Cross and M. Keith. London: Routledge.

Oma and Opa in times of Corona

During a health crisis, the effects of the high paced nature of life in urban spaces including accelerated urbanization, faster and more effective transportation, architectural development, and international tourism become obvious (Keil et al, 2020). In a separate article, Keil et al (2018) discuss the intricacies of the racialization of diseases in Toronto during the SARS outbreak. Interestingly, taking a look at the coronavirus crisis in Amsterdam reveals differing issues of discrimination. Being a capital city as well, the flows of people coming in and out made Amsterdam a hotspot for the virus in the nation. Additionally, the way the government has narrated and implemented policies during the global pandemic reflects a separation of the elderly from the masses, in the name of rationality. This entry will look at the government regulations during the COVID-19 outbreak, and the implications of them.

Amidst this global pandemic, the Netherlands stands out with its relatively lax measures. In March, they openly embraced the controversial idea of herd immunity and have since changed the discourse to ‘intelligent lockdown’, saying that mass lockdown was not feasible. The emphasis is on doing everything in “controlled distribution”; keeping calm, cool, and collected (Holligan, 2020). For a population of 17.2 million, infection rates are, however, relatively high. The government denies any panic, claiming this is due to high levels of reporting.

Mid-lockdown, Vondelpark taken by my sister

Not all businesses are required to shut, only those that involve touching (hairdressers, red light district brothels, beauticians, etc.) You can leave the house for essentials and exercise, as long as you are 1.5 meters away from others (punishable by fines, although city dwellers have indicated a lack of noticing enforcement). Construction work has not been halted in the city, including a replacement of two natural gas plants and an auxiliary heat plant in Diemen by a biomass plant.

Up until the end of March, meetings below 100 were still allowed in comparison to neighboring countries, specifically Belgium, that had already established strict full lockdown. Recreational boats in the cities’ canals were banned in the beginning of April, after warm weather brought many out to pleasure-cruise.

A Little Boatride in the city, mid lockdown: taken by my sister

Prime Minister Mark Rutte claims it is easier to separate generations in the Netherlands, especially in urban spaces, due to the fact that sending the elderly to live in care homes is a large part of Dutch culture (Smits et al, 2014). To exemplify the level of sophistication in the care system, look towards ‘Dementia Village’, just outside of Amsterdam, a ‘cutting edge elder care facility’. Although the Netherlands is advanced in its protection and maintenance of the well-being of the elderly usually, during this pandemic there seems to be an ominous lack of care. This separation looks like a blessing for the young and a death notice for the old.

There is much controversy over the lack of transparency of the situation in elderly homes. In the beginning of April, the public health body (RIVM) announced that out of the 2,500 nursing homes, the virus had reached 40%. More than 1,270 elderly have died.

Amidst ‘advanced care planning’, doctors have been calling the elderly and asking them what they would want, given they fall ill.  Doctors have been advising to ‘think twice’ before agreeing to treatment in intensive care units (van den Berg et al, 2020). The Prime Minister denies criticisms that this is an attempt to ration scarce ICUs, claiming the calls are protocol.

Man can see his wife after visit ban due to the coronavirus disease thanks to a glass barrier: Source

However, not all is so negative. The municipality, amidst this crisis, has decided to change their economic model to a more sustainable ‘doughnut economy’. This is further discussed in this blog post. 

To return to the somber tone: another worrying factor to consider is ethnic disparities among the elderly. The elderly of Turkish and Moroccan descent use the Dutch extensive health care services less than the native Dutch do, due to various cultural differences and language barriers (Denktas et al, 2009). How might this play out during the pandemic? In the context of Amsterdam where half of the residents are from backgrounds other than ethnically Dutch, how do cultural norms within family care-taking affect who is getting ill, and who is economically advantaged? It seems that the government has failed to even acknowledge these highly problematic issues, let alone find a more equitable solution.

It is easy to see that the government’s generalizations about Dutch culture exclude certain groups. Especially when vulnerability to the virus is dependent on privileges (both economic and social), in a city with such pervasive racial inequalities, this can further exacerbate the harm this virus may wreak. Furthermore, the lack of restrictions on construction work shows how during times of economic stress, environmental regulation may take a back seat. Although the environment may be able to take a deep breath of air from the immense drop in pollution from cars and planes, it seems that many will be taking their last breath of air before the city is in the clear.

Word count: 820

References

At5 (2020) “Construction of Diemen biomass power plant may continue: Vattenfall receives a permit”, Echt Amsterdamse Nieuws. Retrieved from: https://www.at5.nl/artikelen/201209/bouw-biomassacentrale-diemen-mag-doorgaan-vattenval-krijgt-vergunning

City of Amsterdam (2020) Coronavirus (COVID-19) in Amsterdam. Retrieved from: https://www.amsterdam.nl/en/news/coronavirus-infection-amsterdam/

Denktaş, S., Koopmans, G., Birnie, E. et al. (2009) Ethnic background and differences in health care use: a national cross-sectional study of native Dutch and immigrant elderly in the Netherlands. Int J Equity Health 8, 35

Holligan, A. (2020) Coronavirus: Why Dutch lockdown may be high-risk strategy BBC News, The Hague. Retrieved from: https://www.bbc.com/news/world-europe-52135814

Shields, B. (2020) “Dutch embrace ‘herd immunity’ as dire death warning prompts UK to change course” The Sydney Morning Herald. Retrieved from https://www.smh.com.au/world/europe/dutch-embrace-herd-immunity-as-dire-death-warning-prompts-uk-to-change-course-20200317-p54arv.html

RIVM (2020) Dutch News. Retrieved from: https://www.dutchnews.nl/news/2020/04/dutch-report-147-more-coronavirus-deaths-virus-is-in-40-of-nursing-homes/

Smits, C., van den Beld, H., Aartsen, M., Schroots, J. (2014) Aging in The Netherlands: State of the Art and Science, The Gerontologist, Vol 54(3) pg 335–343

Cape Town: Into the Beauty


Figure 1: Candelabra Lily found in Strandveld. (University of Western Cape)

Throughout my exploration of UPE issues in Cape Town, I have come across a variety of delightful images which showcase Cape Town’s beauty. The introduction to this blog series was titled “Beyond the Beauty”. However, now it is time to confront the unique flora and fauna of Cape Town. Unfortunately, this examination of nature is not going to be as pretty as the pictures displayed throughout this entry. Nature in the city is under severe threat due to rapid population growth and urbanisation. The disappearance of Cape Town’s unique biodiversity and the ecosystems they deliver has become a global problem (Holmes et al., 2012).

The Cape Flats Dune Strandveld* (CFDS) located on the lowlands of the city is an endangered vegetation type, only found in Cape Town. Studies have revealed that 40 plant species have gone extinct in the Cape Floral Kingdom since 1990, one of the fastest extinction rates on earth (Wild, 2019). The reduction in groundwater used to facilitate development, the loss of domestic livestock, the arrival of alien species and disruptions to fire regime have severely disrupted the ecology within Strandveld (Lockwood, 2019). Urbanisation has already resulted in the extermination of the eland and many other large mammals. It has left the remaining Strandveld fragmented with only 14% being conserved. Increasing urban growth at the expense of the environment raises many ecological concerns. Can Cape Town find a balance between conservation and development needs?


Figure 2: A Malachite Sunbird Perches Between Aloes in Strandveld (Purves, 2019)

Local action and knowledge have made Cape Town a leading city for collective environmental action, widely recognised for their conservation practices. One example is the Bottom Road Sanctuary conversation project which demonstrated how local, indigenous knowledge and genuine care for the environment can undermine governmental action. The Grassy Park’s residents transformed plots of land, often described as rubbish dumps into a restoration project, and this marginal area emerged as a “blueprint” for environmental conservation. The team replanted the lost fynbos in the area, to restore and revive the natural environment (figure 3). However, we cannot ignore the politics behind conservation projects. With numerous human and natural actors at different scales, these projects are inherently political. An understanding of the politics reveals the wider implications on the shaping of the city and people’s lives (Ernstson, 2011). When the residents planted “endangered” fynbos in previously oppressed spaces, the plants became aligned with memories of oppression (Lawhon et al., 2014). This more than human action was not just a conservation project; it empowered people, built a strong community and created shared understanding. This project revealed how bottom-up approaches are crucial to promoting successful environmental action .

Figure 3: Fynbos at Bottom Road Sanctuary (Cape Town in Colour, 2014)

This entry highlights how nature is entangled with social, environmental, economic and political networks. In Cape Town, nature shapes the city. Through conservation projects, nature empowered people and created communities. Cape Town must continue to promote civic collective action among citizens. Citizen scientists and volunteers are crucial to conserving Cape Town’s beauty.

Word Count: 518

References:

Ernstson, H. (2011) ‘Re-translating nature in post-apartheid Cape Town: the material semiotics of people and plants at Bottom Road’, in Heeks, R. (ed) Conference on “Understanding Development Through Actor-Network Theory”, London School of Economics, 30 June, London, (http://bit.ly/Re-translating_Nature_LSE)

Holmes, P. M., A. G. Rebelo, C. Dorse, and J. Wood (2012) ‘Can Cape Town’s unique biodiversity be saved? Balancing conservation imperatives and development needs’, Ecology and Society, 17, 2, 28

Lawhon, M. et al. (2014) ‘Provincialising Urban Political Ecology: Towards a Situated UPE Through African Urbanism’, Antipode, 46, 2, 497–516.

Lockwood, G., 2019. Eland Saving Strandveld Vegetation In False Bay Nature Reserve. [online] Safari News. Available at: <https://www.safari.com/news/featured/eland-saving-strandveld-vegetation/&gt; [Accessed 19 March 2020].

Wild, S., 2019. The Cape’S Plants Are Dying Out – And Local Authorities Need Citizens’ Help. [online] GroundUp News. Available at: <https://www.groundup.org.za/article/capes-plants-are-dying-out-and-local-authorities-need-citizens-help/&gt; [Accessed 19 March 2020].

Figures:

Figure 1: University of Western Cape. Candelabra Lily. [image] Available at: <http://planet.uwc.ac.za/nisl/BDC321/ekapa%20Cape%20Towns%20lowlands/module2/images/Candelabralily.jpg&gt; [Accessed 19 March 2020].

Figure 2: Purves, A., 2019. Sunbirds And Sugarbirds. [online] Arne Purves Photography. Available at: <https://arnepurves.co.za/sunbirds-sugarbirds&gt; [Accessed 19 March 2020].

Figure 3: Cape Town in Colour, 2014. Fynbos At Bottom Road Sanctuary. [image] Available at: <https://capetownincolour.wordpress.com/2014/09/17/part-2-hidden-gems-of-cape-town-zeekoevlei/birdwatchers-viewing-platforms-litter-the-coastline-sml/&gt; [Accessed 20 March 2020].

Design a site like this with WordPress.com
Get started