Bright lights!

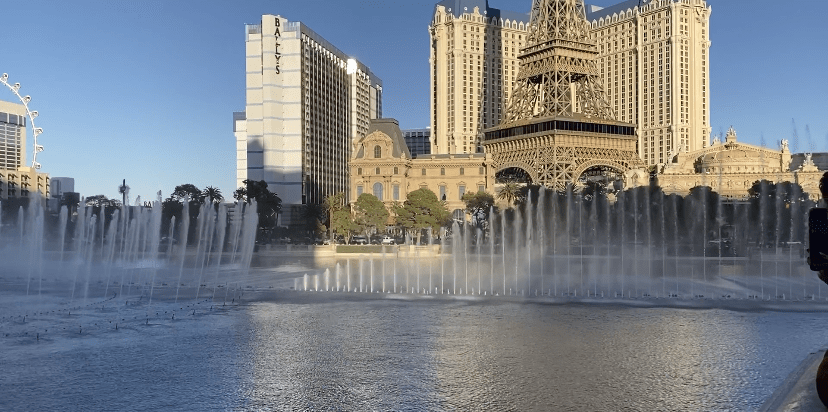
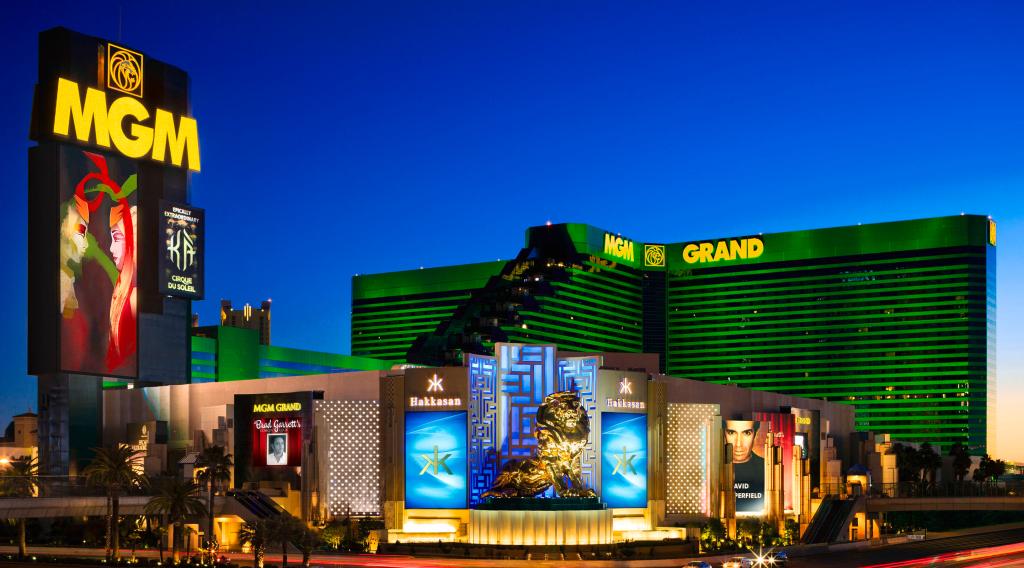
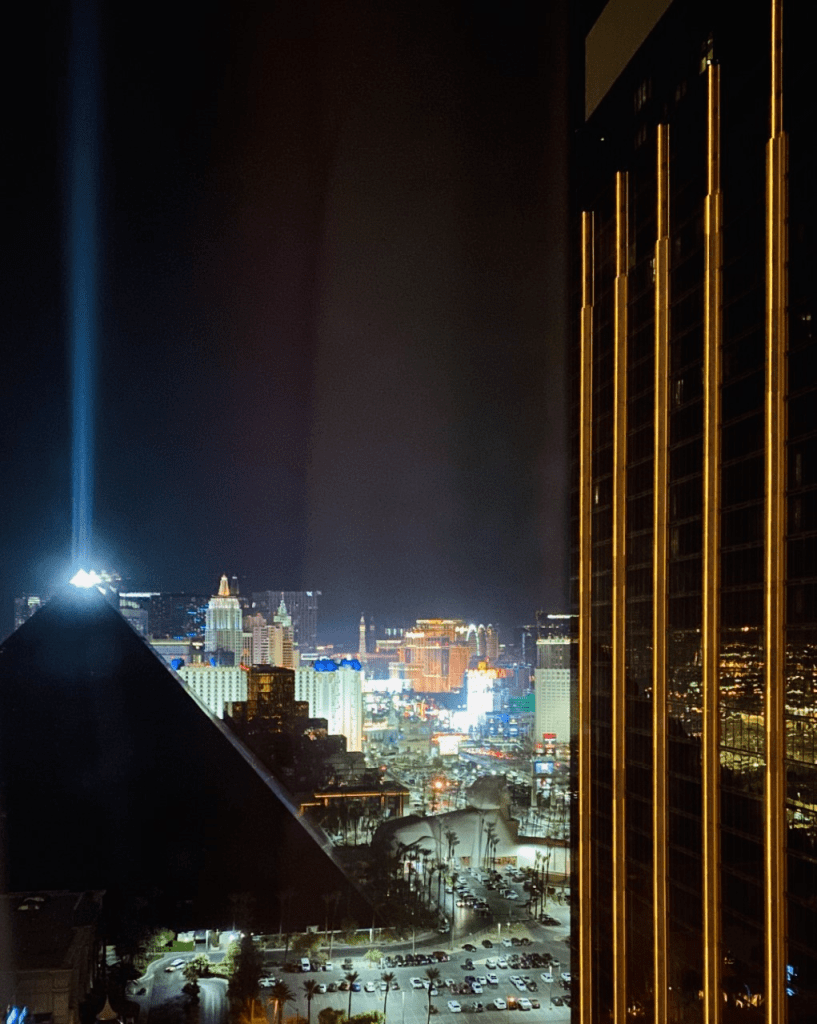
The glittering lights of the Las Vegas strip are no doubt a spectacle to anyone who visits the city. But the lights hold a dark secret – that they’re causing an absurd amount of light pollution!

Light pollution is defined as the ‘wasted light cast in to the atmosphere’ (Ploetz, 2002). Las Vegas certainly casts a lot of light into the atmosphere. So much so that in 1994 a power outage that hit the strip resulted in a vast volume of calls from local residents concerned over a large cloud like object in the sky. That object was part of the galaxy above – which had been obscured from view due to the blinding lights of the city (Drake, 2019).

Las Vegas Strip at night from Mandalay Bay, image taken by myself, 2019

Not only do the lights mean that people cannot stargaze – which is thought to be beneficial to an individual’s health as it is relaxing (Ploetz, 2002). Excessive light productions has been proven to mess with the biochemical rhythms of the body. Meaning sleep patterns are altered and even more worrying rates of cancer and heart disease are increased.

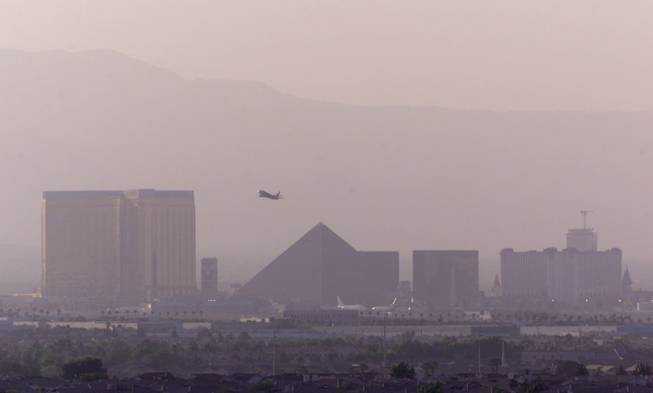
However in this blog I am focusing on the impact the lights in Las Vegas have on the wildlife. The lights on the strip give Vegas the title of brightest place in the world (Dunn, 2017). Satellites from space are not able to pick up the blue light from LED bulbs, meaning that the city is even brighter than what is reported (Dunn, 2017). This poses challenges to migrating birds who get disorientated by the lights (Van Doren, et al., 2017). Birds are known to fly low and in circular motions in the presence of lights – which compromises their ability to migrate. The lights have also been seen to startle the birds and cause them to fly in to building and high-shine windows. Both of these factors has had an impact on the death rate of birds in Las Vegas (Horvath, et al., 2009).

Despite the negatives, the light that beams from the top of the Luxor Hotel (thought to be the strongest light in the world) has been seen to create its own ecosystem. The light is described as a ‘way-point’ and can be detected by pilots passing over the area (Morris, 2017). Moths, bats and birds of prey flock to the beam. This can be seen in the video below. This has arguably made hunting easier for birds of prey – so perhaps the situation isn’t all bad for the birds.

Concerns over the bright lights and air traffic navigation has led to stricter enforcement of switch off times on the strip. Most of the brightest lights are turned off at 1.30am.

With the ongoing Covid-19 situation the strip has been left in complete darkness – which begs the question, where do the birds find their food now and are the lights creating a level of dependency? This related to UPE as all too often policy is implemented with little consideration of the natural environment living in the unnatural city!

Word Count: 496

Drake, N. (2019) Nights are getting brighter and earth is paying the price, (WWW) NatGeo: Washington DC (https://www.nationalgeographic.co.uk/space/2019/04/nights-are-getting-brighter-and-earth-paying-price, last accessed 02/04/20)

Dunn, M. (2017) Good night, night: Light pollution increasing around the globe, (WWW) Las Vegas Sun: Las Vegas (https://lasvegassun.com/news/2017/nov/22/good-night-night-light-pollution-increasing-around/, last accessed 02/04/20)

Horvath, G., et al.,  (2009). Polarized light pollution: a new kind of ecological photo pollution, Frontiers in Ecology and the Environment, 7:6

Morris, H. (2017) The casino light beam that’s so bright it has its own ecosystem (and pilots use it to navigate), (WWW) Telegraph: London (https://www.telegraph.co.uk/travel/travel-truths/famous-waypoints-aviation-luxor-sky-beam/, last accessed 02/04/20)

Ploetz, K. M. (2002). Light pollution in the united states: An overview of the inadequacies of the common law and state and local regulation. New England Law Review, 36(4), 985-1040.

Van Doren, B. et al. (2017) High intensity urban light installation dramatically alters nocturnal bird migration, PNAS

Impeding water doom: Over-allocation of the Colorado River

10cm is the average amount of rainfall experienced in Las Vegas annually, making it highly vulnerable to water shortages (Lasserre, 2015). In the early 1990s it was thought that with the current rate of population growth that Las Vegas only had 6 years before it became a water deficient city (Gerlak & Soden, 1992). Thankfully this has not yet happened. In this blog post I will examine the threat of water shortage in Las Vegas and what has been done to avert this.

Las Vegas draws 90% of its water supply from the Colorado River – the water is collected at Lake Mead – this then supplies the population (Rothberg, 2017). The Colorado River is an over-allocated resource with other states also being largely supplied by the river. The River has been in a period of drought since 2000 (which is thought to be the worst over 1250 years – from tree ring data) (Robbins, 2019). This drought coupled with increased evaporation due to climate change has meant that the Colorado River has more water promised to users than is actually available (Robbins, 2019).

Image 1, Aerial view of Lake Mead, image take by myself, 2019

With the Las Vegas strip showcasing bountiful lush gardens, showstopping fountains and numerous water features, it is often assumed that the hotels and casino are responsible for the depletion of the water. This is wrong, in fact, only 7% of water use is by the hotels and tourists. Due to efficient water collection and recycling, A staggering 60% of water use is actually by the homeowners in residential areas of the city (Lasserre, 2015)!

Image 2, Bellagio Fountains, image take by myself, 2019

The population of Las Vegas has grown considerably since the 1970s, from 227,000 people to over 2million (incl. surrounding outer city suburbs). This has meant that household demand for water has increased. State officials caught wind of this before it was too late and implemented policies to reduce per-capita outdoor water use. Schemes such as offering financial incentives for people to remove their front lawn, coupons and discounts to any individuals using water saving tech – such as pool covers or low flow toilets and laws to restrict car washing and back-yard lawn watering were used (Lasserre, 2015). These worked to reduce per capita water consumption from 350 gallons per day to 212 gallons (1989-2013 respectively) (Lasserre, 2015). Little has been done to reduce indoor waste usage as thanks to an extensive drainage network, a large proportion of the water used is able to be treated and returned to Lake Mead for use once again – a process of urban metabolism (Gandy, 2004).

After being predicted to become water deficient before the millennium Las Vegas has continued to supply its residents successfully. Climate change puts further strain on resources so alternatives do need to be considered. The Southern Nevada Water Authority are lobbying for a 250 mile pipeline to pump groundwater to compliment water supply from the Colorado River (Rothberg, 2019). Although there are concerns that this would alter the ecosystem, and that the groundwater may be contaminated with radioactive material. Objections to this have come from local tribes – who would be removed from their land and environmental groups. Other alternatives include desalination of ocean water – this could be undertaken in California – who are another key user of the Colorado River. By desalinating ocean water less demand would be being put on the Colorado River. Argument for either of these alternatives comes from the potential economic benefit that it would bring. It is unlikely that development in Las Vegas would continue at such a rate if developers thought the area may not be able to cope with the added populations, therefore ‘new’ water sources need to be found (Rothberg, 2017).

So far policy at the local scale has been very successful in reducing demand on the limited supply. This shows how using financial incentives alongside law creation can help urban populations conserve finite resources. Long term alternatives that involve large scale infrastructure are often met with fierce opposition – as is this case with the pipeline options. Officials and Water suppliers argue that they are using the alternatives as a precaution to future populations and to foster future economic development.

Word Count: 684

References:

Gandy, M. (2004). “Rethinking urban metabolism: water, space and the modern city.” City 8(3): 363-379

Gerlak, A. & L. Soden, (1992) Political culture and water politics in Nevada: Las Vegas attempts to quench its thirsts, ProQuest Dissertations and Theses.

Lasserre, F (2015) Water in Las Vegas: coping with scarcity, financial and cultural constraints. City, Territory and Architecture, 2(1), 1–11.                                                                                               

Robbins, J. (2019) The West’s great river hits its limits: Will the Colorado River run dry, (WWW) YaleE360: Connecticut (https://e360.yale.edu/features/the-wests-great-river-hits-its-limits-will-the-colorado-run-dry, last accessed 31/03/20)                                                                                                           

Rothberg, D. (2017) Why Southern Nevada is fighting to build a 250-mile water pipeline, (WWW) Water Deeply: New York (https://www.newsdeeply.com/water/articles/2017/10/12/why-southern-nevada-is-fighting-to-build-a-250-mile-water-pipeline, last accessed 31/03/20)

Further reading:

Page, B. (2005). “Paying for water and the geography of commodities.” Transactions of the Institute of British Geographers 30(3): 293-306.

Cousins, J. (2017) Structuring hydrosocial relations in urban water governance, Annals of the American Association of Geographers, 107: 5, 1144-1161

Toronto and Waste: Environmental justice and the importance of garbage

Economic growth, urbanisation and structures of consumption that are characteristic of modern day developed cities, such as Toronto, correlates with an increase in the amount of solid waste being produced. Increased purchasing power and the corresponding changes to consumption patterns favouring goods such as single-use plastic bottles and cups, clothing and expensive goods like electronics. This follows the linear economic model of industrial capitalism, as seen in figure 1. The stages of development show the extraction of resources, converting them into goods, human consumption and then simple disposal into landfill. However, the 21st century has seen a turn towards recycling and also a circular economy, as two solutions for dealing with the increased amounts of solid waste, instead of the typical landfill and burning. Toronto has a plan to achieve this and similar targets within the coming years. Repurposing goods that have been thrown away has increased in popularity across urban centres around the world (Alexander and Reno, 2012). This blog will discuss how Toronto deals with its solid waste and look to UPE concepts for discussion.

Figure 1: The linear production-consumption-disposal system. Taken from https://sites.google.com/a/mtholyoke.edu/waste/zero-waste?tmpl=%2Fsystem%2Fapp%2Ftemplates%2Fprint%2F&showPrintDialog=1

Waste matters for a variety of reasons. Modern society has produced the image that the environment, whether it be urban or rural, is clean and ordered and that capitalism has been relatively successful in dealing with our increased consumerism. Perhaps more than any other resource, waste exemplifies how modern development has shaped our expectations of modernity in comparison to how it is actually lived (Moore, 2009). In the case of Toronto, the increased focus of working towards a circular economy instead of sending to landfill shows a shift towards this idyllic image of modernity, where waste is dealt with efficiently and creates the fewest impacts on the environment, society and economic performance.

In Toronto, the latest landfill site to be in operation is that of the Green Lane Landfill site. The site takes in around 800 tonnes of recycled waste every day from the 800 garbage trucks that patrol the city each day. The site was bought and developed into a landfill site as the largest site, Keele Valley, was nearing capacity. Canada has one of the largest per capita waste productions in the world (Kaza et al., 2018). Due to Canada’s high economic development and GDP PPP is high, the consumption of goods means that inevitably waste production is going to be high.

A running theme throughout this series of blog posts concerns environmental justice. The site is located near to a settlement of Oneida Nation who complain of severe odours. This has been ongoing since 2010. It is typical throughout the US and Canada that waste sites have been located near to poorer or ethnic minority neighbourhoods. In this case, it is a First Nations settlement that is being impacted, and this issue has been a platform for this community to have their voice heard more. The Oneida have had the issue settled through financial relief, $4 per tonne from landfill and 4% of the gross revenue accumulated. This issue highlights the power relations between the state and society, or at least a certain section of society. The state has the financial and political prowess to simply strike a deal with the Nation, and in doing so can simply set a precedent for future issues.

UPE provides a perfect lens to assess how waste produces injustice in the distribution of power, urban resources and health outcomes. It also highlights the metabolic nature of the urban, and how resources come and go from the rural to the urban and to the rural again, in the case of many landfill sites. The life cycle of waste highlights the links between the social and biophysical systems (Gandy, 2004).

Word Count:

Reference List

Alexander, C. and J. Reno. (eds.) (2012) Economies of Recycling: The Global Transformation of Materials, Values and Social Relations. Zed Books: New York. (1-26).

M. Gandy (2004) Rethinking urban metabolism: water, space and the modern city, City, 8 (3), 363-379.

Kaza, S., Yao, L. C., Bhada-Tata, P., Van Woerden, F. (2018) What a Waste 2.0 : A Global Snapshot of Solid Waste Management to 2050. Urban Development. Washington, DC: World Bank.

S. A. Moore (2009) The Excess of Modernity: Garbage Politics in Oaxaca, Mexico, The Professional Geographer, 61 (4), 426-437.

Additional Material

https://www.toronto.ca/services-payments/recycling-organics-garbage/long-term-waste-strategy/working-toward-a-circular-economy/

https://www.canadiangeographic.ca/article/canadas-dirty-secret

Bringing Waste to Life in Cape Town

Water, for a long time, has been the centre of environmental concern in Cape Town. The city, however, is battling a major “waste crisis” which has been brought to light by the water crisis. Throughout the drought, residents collected water using bottles which drove increases in plastic usage and waste across the city. Cape Town is drowning in waste with experts stating that landfills are filling up at an extreme rate (Githahu, 2019). In 2018, South Africa sent 90% of their 59 million tonnes of general waste to landfill; only 10% of waste was recycled (Department of Environmental Affairs, 2018).

Figure 1: Presents illegal dumping in Cape Town. (Skiplt Green, 2020)

When waste is organised, and out of sight, business continues as usual and urban order is maintained. When garbage, however, is not appropriately managed and starts to stem out of control, it becomes the “ultimate symbol of non-progress” (Fredericks, 2018). Figure 1 illustrates this chaotic mess which presents illegal dumping found at a site in the city. As Cape Town continues to experience rapid population growth and urbanisation, the quantity of waste grows, and the city sends large amounts of waste to landfill. Cape Town is placing immense pressure on the city’s landfill capacity. The city is working to develop solutions to the waste problem by moving towards the concept of a circular economy. In 2016, Cape Town established the Fifty/50 Wheelie Bin program, which has a been hugely successful strategy to divert waste from landfill (C40, 2017). The project has created 22 jobs, a reduction of 63% in global warming potential and city savings of $160,000.

At present, the city does not have a formal recycling programme, and it does not provide incentives for individuals to recycle. Recycling is carried out by the private or informal sector. There are, however, numerous strategies to create a circular economy. Ecopreneurs in Cape Town think differently about waste, not as a challenge or a threat to social order but as an opportunity to innovate, create and improve. Many informal non-profit companies operating within Cape Town have established economically viable green solutions in the city. One such example is the Oranjezicht City Farm (OZCF), a community-based farmers style market. The market is helping to create circular food systems by reducing food, packaging and plastic use (GreenCape, 2020). The OZCF introduced the ‘Bokashi Brigade’ which receives food waste from households and businesses. The market is celebrating local produce and culture while simultaneously bringing the community together. This example highlights the strength of the city’s citizens to make change. Through bottom-up approaches to environmental challenges, people engage with nature and promote sustainable action together.


Figure 2: Oranjezicht City Farmers Market, Cape Town. (Cape Town in Colour, 2015)

Figure 3 depicts a man, Ryan Morris hauling a trolley filled with rubbish down a street in Cape Town. An unusual sight for some, this is an everyday occurrence in Cape Town. Collecting and selling waste is a way of getting by and making a living in Cape Town and many other cities. Waste pickers form part of the urban informal workforce in South Africa, and they are a crucial part of the recycling industry in the city (Langenhoven and Dyssel 2007; Samson 2010). Workers such as Ryan Morris divert waste from going into landfills for little to no cost. Waste pickers collect an estimated 90% of recyclables, saving municipalities R750 million per year in landfill space (Matshili, 2019).


Figure 3: Waste picker, Ryan Morris pulling trolley filled with rubbish. (Farber, 2016)

The video in figure 4 outlines how the Department of Environmental Affairs hosted an integration workshop for waste pickers in Pretoria. The Department is working on guidelines to give waste pickers official status and make them a part of the formal waste sector.

 
Figure 4: Environmental Affairs Department discusses the role of waste pickers (ENCA, 2019)

Waste is more than a tangible object. Understanding waste beyond its physical properties reveals a plethora of social, political and environmental issues. It raises awareness of wide societal processes which are less about waste and more about people, labour, social relations, inequality and more. Waste moves around the city, mixing with people and other metabolisms to produce life and movement. These social processes bring waste to life (Amin, 2014). Through a UPE lens, I have revealed how waste in Cape Town is not just about a city in crisis. Waste is a way of making a living, a platform for creation and innovation and most importantly, it brings people together.

Words: 758

References:

Amin A (2014) Lively infrastructure. Theory, Culture & Society, December 2014, Vol.31(7-8), pp.137-161

C40 cities. 2017. C40: Cities100: Cape Town – Turning Trashed Bins Into Trash Bins. [online] Available at: <https://www.c40.org/case_studies/cities100-cape-town-turning-trashed-bins-into-trash-bins&gt; [Accessed 10 March 2020].

Department of Environmental Affairs, 2018. South Africa State Of Waste Report. [online] Pretoria: Department of Environmental Affairs. Available at: <http://sawic.environment.gov.za/documents/8635.pdf&gt; [Accessed 6 March 2020].

ENCA, 2019. Waste Pickers Key To Recycling Industry: Experts. Available at: <https://www.enca.com/news/waste-pickers-key-recycling-industry-experts&gt; [Accessed 3 February 2020].

Fredericks, R. (2018). Garbage citizenship. Durham, N.C: Duke University Press.

Githahu, M., 2019. ‘Waste crisis’ in spotlight as SA is running out of landfill space. IOL, [online] Available at: <https://www.iol.co.za/capeargus/news/waste-crisis-in-spotlight-as-sa-is-running-out-of-landfill-space-36780078&gt; [Accessed 8 March 2020].

GreenCape, 2020. Building Resilient Urban Communities Through Circular Food Systems: Oranjezicht City Farm And Market. [online] Cape Town: GreenCape. Available at: <https://www.green-cape.co.za/assets/GreenCape_Resilience-Report_Urban_Farming_WEB-1.pdf&gt; [Accessed 8 March 2020].

Matshili, R., 2019. Waste Pickers Collect Up To 90% Of Recyclables Saving Municipalities Millions. [online] IoL. Available at: <https://www.iol.co.za/pretoria-news/waste-pickers-collect-up-to-90-of-recyclables-saving-municipalities-millions-20873584&gt; [Accessed 10 March 2020].

Langenhoven, B., & Dyssel, M. (2007). The recycling industry and subsistence waste collectors: a case study of Mitchells Plain. Urban Forum, 18(1), 114-132. 

Samson, M. (2010). Reclaiming reusable and recyclable materials in Africa: a critical review of English language literature. http://www.inclusivecities.org/research/RR6_Samson.pdf. Accessed on 10 March 2020. 

Figures:

Figure 1: SkipIt Green. 2020. Cape Town: Illegal Dumping Is Widespread In Our Community – Skipit Green. [online] Available at: <https://www.skipitgreen.co.za/illegal-dumping-cape-town-south-africa/&gt; [Accessed 10 March 2020]

Figure 2: Farber, T., 2016. Meet the bin scavengers saving SA R750-million a year. Sunday Times, [online] Available at: <https://www.timeslive.co.za/sunday-times/news/2016-05-08-meet-the-bin-scavengers-saving-sa-r750-million-a-year/&gt; [Accessed 13 March 2020].

Figure 3: Cape Town in Colour, 2015. CAPE TOWN FARMERS MARKET RELOCATES TO THE V&A WATERFRONT. Available at: <https://capetownincolour.wordpress.com/tag/oranjezicht-city-farm/&gt; [Accessed 13 March 2020].


Las Vegas’ waste recycling… and pig farms?

It has been apparent that in recent years a new problem of increased waste has emerged. Coupled with economic growth and urbanisation there has been a rise in consumerism hence creating larger amounts of rubbish – the majority of which is being either sent to landfill or ending up in oceans. There is now a growing sector for repurposing old goods to avoid sending as much to landfill (Alexander and Reno, 2012). This relates to UPE as it represents the notion of the circular economy. Urban centres are largely responsible for the waste problem but through policy and intervention they are giving the poorer (both in the local community and elsewhere across the globe) access to disused items – alleviating the burden on landfill sites.

In Las Vegas the main landfill site (Apex), receives roughly 300 tonnes of rubbish every hour (Robison, 2013). This gives the site the title of being the largest landfill site and also the site which receives the highest tonnage of rubbish in the USA (Robison, 2013). This is likely due to the high amount of tourists that visit the city. It is proven that the average hotel guest accumulates over 1kg of rubbish per day of their trip (Pirani and Arafat, 2014). In a city like Las Vegas it is likely to be considerably higher as excessive spending on luxury items and also food is common for visiting tourists. This has left residents in communities around the city concerned for their personal wellbeing due to the high amount of rubbish that surrounds them, and demanding evidence that hotels and casinos are acting with corporate environmental responsibility (Cummings, 1997).

However, hotels and casinos in Sin City are doing their bit to try and minimise the waste that they send to landfill. At Caesars Palace in 2017, 41% of its waste was diverted from landfill, this increased to 49% in 2018. It is hoped that by 2025 60% of the waste will be diverted. These reductions have occurred by donating and redistributing unused bar soap from hotel bathrooms and also donating unused furniture after refurbishment (Caesars, n/d).

Nearly 50% of all waste produced in the hospitality sector is from food waste – this could be food that has passed its expiration date or leftover scraps from customers plates (Pirani and Arafat, 2014). It is assumed that 95% of this waste could be recycled or composted, however all too often food waste ends up in landfill. This poses further challenges as food waste decomposes and produces methane, this has a pungent odour which is problematic for communities living near to landfill facilities whilst also exacerbating and adding to the greenhouse gas problem (Sullivan, 2011).

Hotels are trying to deal with their food waste in innovative ways this is in line with guidance from the EPA (environmental protection agency) (Ewing, 2016). The MGM hotels in Las Vegas are leading the way and have seen savings of up to $9000 per month by making small changes (EPA, n/d). The MGM Grand hotel now donates food that is about to expire to foodbanks – it also collects any non-perishable items from minibars that have passed their expiration date. These are deemed OK to eat a year after the best before date. This then also get sent to local food donation centres (Curtis, 2018). Banquet food from buffet restaurants and conferences are repurposed to make individual meals for homeless shelters. It is expected that by 2021, 80,000 meals will be created by repurposing food that would otherwise go to waste (Curtis, 2018). The MGM hotels also sort through their food waste and collect the organic food waste. This is then cooked and processed and sent to LVL livestock farms in Nevada State. This can feed up to 12,000 pigs per day. This shows how urban waste can lend a hand in a more rural setting.

Image 2, MGM Grand Hotel (https://mgmgrand.mgmresorts.com/en.html)

Arguably the only reason that big corporations are tackling their waste is due to guidelines imposed by the EPA, ensuring that their reputation is not tarnished by showing a lack of consideration for local communities and cost saving that occurs from the reduced waste. There is potential for further improvement in the waste sector. Leftover fats and oils have the potential to be turned in to fuel sources and methane captured from the food waste that does make its way to landfill could be used to power up to 800 homes in Las Vegas (Ewing, 2016). These are all potential avenues to be explored in future years, but for now Las Vegas is making steady progress to reduce its overall waste.

Word Count: 737

References:

Alexander, C. and J. Reno (eds.) (2012) Economies of Recycling: The Global Transformation of Materials, Values and Social Relations. Zed Books: New York. (1-26)

Casers (n/d) Our waste reduction (WWW) Casers: Nevada (https://www.caesars.com/corporate/corporate-social-responsibility/planet/waste, last accessed 21/03/20)

Cummings. L.E. (1997) Waste Minimisation Supporting Urban Tourism Sustainability: A Mega-Resort Case Study, Journal of Sustainable Tourism, 5:2, 93-108

Curtis, A. (2018) Question of the day – 27 Dec 2018 (WWW) Las Vegas Advisor: Las Vegas (https://www.lasvegasadvisor.com/question/food-waste-las-vegas/, last accessed 21/03/20)

EPA (n/d) Links and resources about food recovery in Las Vegas (WWW) EPA: Washington (https://www.epa.gov/sustainable-management-food/links-and-resources-about-food-recovery-las-vegas, last accessed 21/03/20)

Ewing, T. (2016). Food waste recycling poses local challenges, Planning 82(5), 12.

Pirani, S. & H. Arafat, 2014. Solid waste management in the hospitality industry: A review. Journal of Environmental Management, 146, p.320

Sullivan, D. (2011). Improving economics of food waste recycling, Biocycle, 52(1) 20-22

Urban Risk: Earthquakes in Las Vegas

The concept of the ‘urban’ implies a metropolitan area with an economy centred around the secondary or tertiary sector (Pelling, 2003). Risk implies the likelihood or harm and severity at which this happens (UNLV, n/d). Urban risk is therefore thought of as the challenges faced by metropolitan areas in the wake of disasters. With the ever increasing rate of climate change and the continued sprawl of urban cities, economic and social risks are becoming more and more prevalent.

Image 1, Richter scale, https://shutterstock.com

For Las Vegas, disasters can take many forms such as wildfires, droughts and flash flooding. Seismic activity also threatens the city. Mitigating the risk is key to protecting the city and its population. In this blog post I will consider the risk of earthquakes faced by Las Vegas and how the state officials have tried to deal with this

Nevada is the 3rd most seismically active state in the USA (UNLV, n/d). There are faults running through the Las Vegas Valley capable of producing a magnitude 6 earthquake. There is also significant threat from faults near to the California-Nevada border in Death Valley (Johnson, 2019).  These faults are capable of producing a 7.8 magnitude earthquake. The seismic waves from this would be felt throughout the city of Las Vegas despite its distance away from the epi-centre.  This is due to the rock structure of the Las Vegas Valley. The Valley is bounded by a hard bed rock and filled with soft sediment – this amplifies seismic waves by trapping them, hence why quakes are still felt a considerable distance away from the faults that created them (UNLV, n/d). In July 2019 an earthquake occurred. Its epicentre was located roughly 200 miles from Las Vegas, in Ridgecrest CA. Many of the shows in Las Vegas were stopped for the evening and viewing decks in some of the hotels were closed to inspect for damage and to protect tourists. Thankfully though, there was very little damage and normal business operation resumed quickly.

Newsclip: 04/07/19 – http://www.youtube.com

Is the significant lack of damage from a powerful earthquake due to the Las Vegas planners? – It very well could be. State officials issued building codes in the 1990s. These were made so that the Las Vegas strip could be earthquake proofed (Mullennix, 2019). For many of the builders and hotel owners going ‘over-code’ was common. This meant that the hotels went above and beyond the needed regulations. Reasoning for this is likely that businesses did not want to incur any losses and cease operation in the face of disaster, as tourists are the main source of income in the city. However, building standards are far less stringent on the outskirts of the city in urban dwellings. The majority of these homes were built just after WW2 and are more prone to damage from seismic activity. In these areas mitigation of earthquake risk comes in the form of disaster evacuation plans. Clark County have made an app that helps homeowners create their emergency contingency plan. It encourages stock-piling and the purchase and use of solar electricity storage – if power outages were caused (Maldonado, 2019). This is a similar story in many urban dwellings in the USA. Response to disasters is usually about repairing the damage in the wake of a disaster – rather than preventing the damage in the first place (UNDRR, 2019). This is due to the high cost of retro-fitting buildings to fit codes issued in 1990. In Reno – another city in Nevada state buildings are not up to code and a significant earthquake could see it destroyed as badly as Christchurch was in NZ in  2011 (Johnson, 2019).

There are calls for urban risk to be better studied to avert disastrous impacts of natural events (Schipper, et al. 2016). In Nevada this is currently happening by studying fault lines, this is aided by ever improving technology and knowledge of seismic events (Cutter, 1996). In doing so it is hoped that intervention can be strategically targeted (Avila and Wilcox, 2016).

In terms of the relation of urban risk to the study of urban political ecology, I shall break it down. Urban populations are significantly more at risk of disasters due to development and sprawl. In Las Vegas the risks from earthquakes is heightened due to the densely packed nature of buildings and the high number of people found in the city. Policy is being implemented to ensure buildings are up to standard (political) – however this is only enforced for the buildings along the strip – the area that would be economically worst hit if damage to buildings and loss of life occurred. This gives the impression that the financial prosperity of the city is far more important than the populations residing there. Despite this, earthquakes remain a relatively random phenomenon – whilst their cycles can be roughly predicted, random events can still occur. Therefore, as is the focus with much academic writing, planning for and mitigation of disasters in major cities needs to happen pre-event. Cities all too often take action in the wake of disaster – and often times this is too little too late.

Building codes information can be found here: www.clarkcountynv.gov/fire/oem/services/Documents/Emergency%20Preparedness%20Guide.pdf

Word Count: 826

Reference list:

 Avila, S. and C. Wilcox (2016) Clark County structures built for earthquake safety (WWW) 3 News: Las Vegas (https://news3lv.com/news/local/clark-county-structures-built-for-earthquake-safety, last accessed 18/03/20)

Cutter, S. L. (1996). Vulnerability to environmental hazards. Progress in Human Geography, 20(4), 529–539.

Johnson, B. (2019) Is Nevada at risk for a large and devastating earthquake, (WWW) KNPR: Nevada (https://knpr.org/knpr/2019-07/nevada-risk-large-and-devastating-earthquake, last accessed 19/03/20)

Maldonado, C. (2019) Eathquake preparedness: How to prepare for a natural disaster, (WWW) KTNV: Las Vegas (https://www.ktnv.com/news/earthquake-preparedness, last accessed 18/03/20)

Mullennix, W. (2019) Can Las Vegas hotels really withstand earthquakes:  top tips for quakes (WWW) Visit Las Vegas: USA (https://www.feelingvegas.com/can-las-vegas-hotels-really-withstand-earthquakes/, last accessed 18/03/20)

Pelling, M. (2003). The vulnerability of cities: Natural disasters and social resilience. Earthscan Publications. Chapter 2. 

Schipper, E. L. F., Thomalla, F., Vulturius, G., Davis, M., & Johnson, K. (2016). Linking disaster risk reduction, climate change and development. International Journal of Disaster Resilience in the Built Environment, 7(2), 216–228. 

UNDRR. (2019). Global Assessment Report on Disaster Risk Reduction. Distilled. (p. 28). United Nations Office for Disaster Risk Reduction. https://gar.unisdr.org/sites/default/files/gar19distilled.pdf

UNLV (n/d) Earthquakes in Southern Nevada: Knowing the risk and how to prepare (WWW) UNLV : Las Vegas (https://www.unlv.edu/news/release/earthquakes-southern-nevada-knowing-risk-and-how-prepare, last accessed 18/03/20)

Urban Nature: Rooftop gardens

Cities are made by nature, but equally, they shape the ways in which nature flows through the built environment of towns and cities. This is understood through the idea of ‘metabolism’, both as a metaphor and as a practice.

‘These assemblages…are simultaneously real, like nature; narrated, like discourse; and collective, like society’ (Sywngedouw, 2003). This quote will be broken down in sections using rooftop gardens across Toronto as the case study to exemplify the ways in which nature and urban environments interact with one another.

As cities in North America, and increasingly across the world, continue to sprawl, there is a call for creative ways to incorporate the offering of green space for a variety of reasons, whether this be for ecological, aesthetic or leisure benefit, or a combination of these (Thwaites, 2001).

They have numerous ecological benefits, ranging from the reduction of stormwater overflow, urban heat effect, and an increasing interest into how they provide a new habitat for insects, birds and plant species to flourish (Butler, Butler and Orians, 2012). Conversely, they are seen to be of benefit to society, or at least certain sections such as those who reside in apartment blocks and office workers. Green roofs provide such urbanites with psychological benefits associated with care and relaxation, and the underlying value of aesthetics in the construction and design of contemporary building (Loder, 2014).

Image result for rooftop gardens toronto
http://torontourbangrowers.org/news/tour-of-regent-park-rooftop-gardens

Breaking down the aforementioned quote by Sywngedouw (2003), garden rooftops in Toronto highlight the materiality of nature within an urban context. ‘Real, like nature’, suggests that rather than simply identifying the metabolic features of nature in urban, such as a park or a flowing river, we need to consider the physical properties and the ways in which they act and therefore how we change our ways in dealing with them. The ways in which garden rooftops promote increased species of animals and plants, as well as the cooling impact that they have. This occurs via shading and reflecting solar radiation, keeping the energy balance (MacIvor et al., 2016).

The second part, ‘narrated, like discourse’ raises debate over what we consider to ‘nature’ and ‘Nature’. David Harvey once referred to NYC as being completely natural (1993), but there is a debate ongoing about what is natural and unnatural in urban environments. As the above suggests, rooftop gardens are essentially natural. They provide a basis for various form of life to exist and flourish, as well as their impacts on cooling. However, the flip side to this is that this is a man-made construction of ‘Nature’. The obvious creation by humans of nature in the form of a green roofs meant that the level of nature was curbed (Loder, 2014). The constructed and planned nature of the gardens thus diminish how natural they are.

An underlying question within the Urban Political Ecology literature revolves around justice and whether the natural environment within urban areas is ‘collective, like society’. In this instance, it appears that the majority of garden rooftops are located on buildings that are office spaces downtown, the main financial area, and also on apartment areas that are primarily occupied my middle to high income workers, as their desires for aesthetically-pleasing and psychologically beneficial are typically higher (Van den Berg et al., 1998).

The growth of urban rooftops in Toronto is only going to increase as the local authorities continue to promote their implementation. This blog post has thus highlighted their benefits, and the ways in which rooftops can be understood through a UPE lens. I have suggested that we need to understand the materiality of natural features, the debate over what is ‘Nature’, and who is benefiting from green roofs in Toronto.

Word Count: 614

Reference List

Butler, C., Butler, E., & Orians, C. M. (2012) ‘Native plant enthusiasm reaches new heights: Perceptions, evidence, and the future of green roofs’, Urban Forestry & Urban Greening, 11 (1), 1–10.

 Harvey, D. (1993) “The nature of environment: dialectics of social and environmentalchange”. In R. Miliband and L. Panitch (eds)  Real Problems, False Solutions. A specialissue of the Socialist Register . London: The Merlin Press.

Loder, A. (2014) ‘There’s a meadow outside my workplace’: A phenomenological exploration of aesthetics and green roofs in Chicago and Toronto’, Landscape and Urban Planning, 126, 94-106.

Swyngedouw, E. and N. C. Heynen (2003) ‘Urban Political Ecology, Justice and the Politics of Scale’,  Antipode 35 (5), 898-918.

Thwaites, K. (2001) ‘Experiential landscape place: An exploration of space and experience in neighbourhood landscape architecture’, Landscape Research, 26 (3), 245–255.

Van den Berg, A. E., Vlek, C. A. J., & Coeterier, J. F. (1998) ‘Group differences in the aesthetic evaluation of nature development plans: A multilevel approach’, Journal of Environmental Psychology, 18, 141.

Ozone pollution…is it inevitable?

Improving air quality is an issue that many urban cities are faced with. Las Vegas is certainly no exception. Ozone and particulate pollution (PM2.5) are the pollutants that are causing the most problems within the city (Martinez, 2019).

Ozone (O3) is formed by a reaction between molecules of NOx from car exhaust fumes or VOCs (volatile organic compounds) in the presence of  UV light. With Las Vegas receiving high amounts of sunlight, elevated ozone levels are virtually unavoidable (Wilson, 2019). However, they can be managed. Ozone irritates the lining of the lungs. In 2018, ozone pollution was responsible for 97 deaths and 114 hospitalisations (Miller, 2019; McFarland, 2019).

Extreme climatic events are becoming more frequent due to climate change. For the West Coast of American drought and wildfires are some of the extreme events experienced. The Californian wildfires in 2018 were the worst on record – with record breaking destruction and devastation. The fires had a knock on effect on the ozone pollution in Las Vegas. So called ‘background ozone’ – or ozone that would be otherwise undisturbed is released through the burning of forests (Rice, 2015). This is then able to move via wind to other locations – such as Las Vegas. This suggests that perhaps the ozone problem is out of control of Nevada state officials.

Extreme climatic events are becoming more and more frequent due to climate change. The severity of the events is also increasing. For the West Coast of American drought and wildfires are some of the extreme events experienced. The Californian wildfires in 2018 were the worst on record – with record breaking destruction and devastation. The fires had a knock on effect on the ozone pollution in Las Vegas. So called ‘background ozone’ – or ozone that would be otherwise undisturbed is released through the burning of forests (Rice, 2015). This is then able to move via wind to other locations – such as Las Vegas. This suggests that perhaps the ozone problem is out of control of Nevada state officials.

Whilst this is somewhat true, progress has been made to reduce point source emissions that could add to the ozone problem. In Nevada state in Clark County (were Las Vegas is located) the Clean Air Excellence Award has been won. This is for the county’s efforts to reduce the number of vehicles on Las Vegas roads through the ‘Club Ride Commuter Service’ (Clark County, 2015). As part of the service citizens are encouraged to car-pool, ride their bikes more often and where possible compress their working week to limit travel. Along with this, map apps have been created to show the routes with the least congestion to stop fumes from idle cars adding to the pollution problem (Clark County, 2015).

Report suggests air pollution is among the worst in the USA, http://www.youtube.com

Ozone pollution peaked in 2007 and has reduced gradually since then. The was a spike in the severity of the problem in the wake of the 2018 wildfires. The level of ozone is continually monitored and there has now been an emergence of citizens using portable sensors to monitor the air that they are breathing in (Snyder, 2013). Data collection regarding air pollution is often confined to a limited number of locations this is why residents have begun to take matters in to their own hands (Buzzelli, 2008). According to researchers at UNLV – who specialise in air quality in the city, the pollution problem is worse in the less desirable neighbourhoods in Las Vegas (Wilson, 2019). These homes tend to be located nearer to highways and hence the populations are troubled by excess pollutants from the high volume of cars that pass through (Kimborough, 2011). By monitoring the air with personal sensors citizens are better equipped to deal with the problems associated with poor air quality and are more inclined to take action over the issue.

Image 1, smog created by ozone over Las Vegas, https://lasvegassun.com/news/2014/apr/30/american-lung-association-says-las-vegas-among-nat/

The issue of ozone pollution in Las Vegas is severe. In 2018 numerous deaths happened with an estimated cost in health-care of $898million. Whilst Clark County officials are implementing policy to encourage reduced car use the problem is still likely to persist. Citizens are now taking a more active role in the pollution problem by monitoring the air quality and taking necessary action to ensure their health is not hampered by ozone pollution. Las Vegas’ desert location means that ozone pollution is almost inevitable due to the strong UV radiation. With climate change increasing the instances of extreme weather events the problem is likely to get significantly worse in years to come (Graham, 2015). This suggests that perhaps legislation and action needs to be enforced on a global scale to halt the rapid rate at which climate change is happening alongside local policies.

Word Count: 642

References:

Buzzelli, M. (2008). “A political ecology of scale in urban air pollution monitoring.” Transactions of the Institute of British Geographers 33(4): 502-517. 

Clark County (2015) Clark County department of air quality: Ozone advance programme, Progress report

Graham, S. (2015). “Life support: The political ecology of urban air.” City 19(2-3): 192-215. 

Kimborough, S. et al. (2011) Long term continuous measurement of near-road air pollution in Las Vegas: seasonal variability in traffic emissions impact on local air quality, Air Quality Atmosphere and Health, 6: 295-305

Martinez, J. (2019) Las Vegas air quality worsened for ozone, particle pollution, (WWW) American Lung Association, Chicago, (https://www.lung.org/local-content/_content-items/about-us/media/press-releases/new-report-las-vegas-air.html, last accessed 13/03/20)

McFaland, K. (2019 Air pollution costing Nevadans millions in health bills, (WWW) KTNV: Las Vegas (https://www.ktnv.com/news/study-air-pollution-costing-nevadans-millions-in-health-bills, last accessed 13/03/20)

Miller, C. (2019) Report says Las Vegas air quality is among worst in America but official cite progress, (WWW) 3 News: Las Vegas (https://news3lv.com/news/local/report-says-las-vegas-air-quality-is-among-worst-in-america-but-officials-cite-progress, last accessed 13/03/20)

Rice, E. (2015) The consequences of forest fires: smoke and ozone, (WWW) B3: USA (http://www.b3strategies.com/2015/10/the-consequences-of-forest-fires-smoke-and-ozone/ ,last accessed 13/03/20)

Snyder, E. et al. (2013) The changing paradigm of air pollution monitoring, Environment Science and Technology, 47:20, 11369-11377

Wilson, M. (2019) Is Las Vegas doomed to poor air quality? Not necessarily experts say, (WWW) Las Vegas Sun: Las Vegas (https://lasvegassun.com/news/2019/mar/10/las-vegas-air-quality-where-are-we-now-and-what-is/, last accessed 13/03/20)

Urban Risk: How Toronto deals with a natural hazard

The acceleration of climate change and the increasing prevalence are arguably the most serious of risks to development of urban areas, providing an ever increasing concern for city authorities and planners (Wamsler, 2014). The increase in prevalence means that there is a greater risk of greater social and economic losses as a result of a disaster, hazard or climate change.

Growth in urban disaster statistics is typically explained by the rapid expansion of cities, in size, in population and also density with many examples, especially in the developing world, where between 2000-2015, 65 million are added annually, 93% in developing countries (Pelling, 2003). Population growth and the increasing sprawl of cities may be too simplistic to explain the increasing prevalence of disasters and their greater impact, as they represent a neo-Malthusian explanation where population growth has a direct link to environmental impacts as well as risk increasing (Coleman and Schofield, 1986).

This blog will use the ice storms of 2013 to highlight the ways in which Toronto deals with nature hazards, and also how cities adapt, attempt to minimise risk and increase resilience.

Damage to a car from a fallen tree. Available at: https://nationalpost.com/news/canada/toronto-ice-storm-2013-photos-from-the-gtas-winter-nightmare

Nirupama et al.’s publication (2014) provides an overview over historical and contemporary hazards impacting Toronto and Ontario as a region.

Toronto was the hardest hit by the 2013 ice storm in North America. The storm produced a layer of ice that caused damage to ecology, property and infrastructure (Armenakis and Nirupama, 2014). Freezing rain fell and created ice of greater than 6mm, the level for it to be classed as an ice storm. Total ice accretion came to around 30mm over 20-21 December 2013.

Perhaps the most telling impacts were felt on urban forestry and infrastructure. Trees which were already fragile due to the time of year, and damage to these brought down power lines, leaving over one million people without power (Nirupama et al., 2014). The impact on power sources meant that traffic systems, urban transport and telecommunications were significantly disrupted. These highlighted vulnerability within the city. Traffic collisions increased massively and people’s mobility was reduced due to decreased transport services.

Health risks also exponentially increased. Two hospitals were running on back up power supplies, injuries due to slippages increased, and carbon monoxide poisoning from generators was reported (Schwartz, 2014).

In response, emergency help centres were set up across the City, providing accommodation, food and cleaning facilities for those most affected by the power outages. It took over a week for full power to be restored to all across the region (Armenakis and Nirupama, 2014).

How this links to urban political ecology is multi-stranded. There is the discussion around how prepared cities, Toronto in this instance, are for dealing with natural hazards. The ice storms of 2013 highlighted some weaknesses and certainly created some lessons to be learnt.

Ecology in this case plays a significant role in not only creating damage, in that trees caused power lines to be damaged, but also their management prior to another storm occurring is critical in minimising the risk and increasing resilience. Managing the tree canopies in urban settings is thus critical, and of course this has knock-on impacts to urban wildlife, habitats and species found within the urban forestries and canopies.

The political and urban sense comes from the response and preparation that the city has to show for future events. The 15,000km overheard power line network of Toronto if made underground could cost as much as $1.5 billion (Armenakis and Nirupama, 2014), but avoids the risk of ice accumulation and damage from trees. But, who pays for this, who benefits most and least, who will have access to upgraded services, are all issues to be considered.

Word Count: 619

Reference List

Armenakis, C., and Nirupana, N. (2014) Urban impacts of ice storms: Toronto December 2013, Natural Hazards, 74, 1291-1298.

Coleman D., and Schofield R. (1986) eds., The state of population theory: Forward from Malthus. Oxford: Basil Blackwell.

Pelling, M. (2003). The vulnerability of cities: Natural disasters and social resilience. Earthscan Publications.

Schwartz, B. (2014) Quote reported by Alex Ballingall in ‘‘ice storm aftermath: four ways Toronto is vulnerable when freak weather hits’’, thestar.com. 10 Jan 2014.

Wamsler, C. (2014). Cities, Disaster Risk and Adaptation. Routledge.

Extra information

Emergency Management Ontario (EMO) is the provincial public emergency agency that is responsible for recording events, and provide plans for people, property and environment.

YouTube video of a Toronto news broadcast at the time of the Ice Storm in 2013. Available at: https://www.youtube.com/watch?v=mFjt0elh5AY

Cape Town: Eco-Apartheid

Figure 1: 4-bedroom property for sale in Chapman Bay Estate (CBE). Source: Property24

In my first blog, I discussed the stark inequalities between the informal settlement of Masiphumelele and the Lake Michelle gated eco-estate. Gated communities in South Africa have begun to brand themselves as eco-estates, and nature estates. The Noordhoek mountains of Cape Town are currently transforming into green eco-estates which serve the needs of the affluent populations of the city. The proliferation of eco-estates has been an increasingly prominent form of development across the world, and they have become progressively popular within South Africa. These lucrative, luxury and lavish estates lie on the pristine urban edge creating a safe and secure environment. To top it off the estates provide a green and sustainable lifestyle.

Figure 2: Promotional video of Chapman Bay Estate ((GreeffPropertiesSA, 2014)

Chapman’s Bay Estate is an eco-estate situated in the Noordhoek mountains of Cape Town. 3-metre-high perimeter fences surround the estate, and CCTV cameras are on the connecting poles. Figure 1 presents one of the modern and luxurious houses on offer within the beautiful setting of Lake Michelle. Three private companies lead the development of the Chapman Bay Estate, including Greef properties (Baigrie and Ernstson, 2017). The video attached is a promotional clip created for the Chapman Bay Estate (Figure 2). The population of Cape Town consists of 42.4% coloured, 38.6% African Black, 1.4% Asian, 1.9% other and 15.7% white (Lehohla, 2012). Yet, the video only shows white people and families smiling and enjoying the premium lifestyle.

Nature

The marketing and consumption of nature is a distinguishing feature in the formation of eco-estates. Nature is entwined with the city. A team of world-renowned environmental impact specialists, ecologists and fynbo experts are working together to ‘build’ an intricate eco-system (CBE, 2019). The use of native and indigenous plant species is a common feature in the landscape design of gated estates. The Chapman Bay website describes how the “natural wetlands are being preserved and enhanced to protect the endangered Leopard Toad” and the estate will additionally be “designed to cater specifically to the needs of the natural fynbos, which is part of the Cape Floral Kingdom” (CBE, 2019). However, the reality is not so picture-perfect. These estates hide the large-scale destruction of vegetation and habitats which is central to their design and development. Nature is neglected, removed, recreated and replaced by more attractive and ascetically pleasing forms of nature. This new nature has numerous functions within the city, primarily helping to sell properties within the eco-estates, but it is also contributing to a larger movement towards sustainable development.

Protect and Exclude

These estates are wrapped in a language of sustainability and conservation which brush over concerns about social and environmental justice. The developers promote these estates as sustainable, utopian enclaves sat in the heart of nature, and they are selling out fast. The success of the Chapman Bay project has been attributed to environmental friendliness and a common desire to do things right. These estates claim to be protecting nature and doing good, but this is, of course, not the case.

Remove the greenwashing, and it is clear that the estate protects the wealthy from the uncomfortable and unpleasant reality of the Masiphumelele neighbourhood, a common occurrence in South Africa. Wealthy suburbanites are allowed to escape the diverse and dangerous post-apartheid city and reunite with nature. Homeowners can live safe and peaceful lives in a protected estate while feeling proud and kind as they are ‘protecting the environment’. Residents are separated from the broader realities of urban life and live out a ‘geographical escapism’ (Ballard and Jones, 2011). Residents will have access to a wide range of amenities, including a shopping mall which is also marketed as green and eco-friendly (McCain, 2015).

This estate represents a microcosm of the larger problems of social justice and environmental fragmentation within Cape Town. The production and consumption of eco-estates reproduce inequalities. Protected by stainless steel and electric, I think it is evident that these estates are built to exclude.

Word Count: 671

References:

Ernstson, H. and Baigrie, B. (2017). Noordhoek eco-estates protect the rich from the reality of Masiphumelele. GroundUp.

 Estate Living. (2020). Chapman’s Bay Estate | Estate Living. [online] Available at: https://www.estate-living.co.za/news/chapmans-bay-estate

Ballard, Richard and Jones, Gareth A. (2011) Natural neighbours: indigenous landscapes and ‘eco-estates’ in Durban, South Africa. Annals of the Association of American Geographers, 101 (1). pp. 131-148. DOI: 10.1080/00045608.2010.520224

Chapmansbay.co.za. (2019). Chapman’s Bay Estate. [online] Available at: http://www.chapmansbay.co.za/index.html

Lehohla, P., 2012. South African Statistics, 2012. [online] Cape Town: Statistics South Africa. Available at: <http://www.statssa.gov.za/publications/SAStatistics/SAStatistics2012.pdf&gt; [Accessed 1 March 2020].

Mccain, N. (2015). New mall in time for Christmas. News24. [online] Available at: https://www.news24.com/SouthAfrica/Local/Peoples-Post/New-mall-in-time-for-Christmas-20150601

Figures:

Figure 1: Property24. (2020). 4 Bedroom House to Rent in Chapman’s Bay Estate. [online] Available at: https://www.property24.com/to-rent/chapmans-bay-estate/noordhoek/western-cape/16016/108506466

Figure 2: GreeffPropertiesSA, 2014. Chapman’s Bay Estate – Greeff Properties. Available at: <https://www.youtube.com/watch?v=or08xWKib_0&gt; [Accessed 6 March 2020].

Design a site like this with WordPress.com
Get started